
UNITED STATES
SECURITIES AND EXCHANGE COMMISSION
Washington, D.C. 20549
FORM
CURRENT REPORT
Pursuant to Section 13 or 15(d) of the Securities Exchange Act of 1934
Date of Report (Date of Earliest Event Reported):
(Exact name of registrant as specified in its charter)
| (State of Incorporation) | (Commission File Number) | (IRS Employer Identification No.) |
| (Address and Zip Code of Principal Executive Offices) |
| Registrant’s telephone number, including
area code: ( |
Not Applicable
(Former name or former address, if changed since last report)
Check the appropriate box below if the Form 8-K filing is intended to simultaneously satisfy the filing obligation of the registrant under any of the following provisions:
Securities registered pursuant to Section 12(b) of the Act:
| Title of Each Class | Trading Symbol(s) | Name of Each Exchange on Which Registered | ||
Indicate by check mark whether the
registrant is an emerging growth company as defined in Rule 405 of the Securities Act of 1933 (§ 230.405 of this chapter)
or Rule 12b-2 of the Securities Exchange Act of 1934 (§ 240.12b-2 of this chapter). Emerging
growth company
If an emerging growth company, indicate by check mark if the registrant has elected not to use the extended transition period for complying with any new or revised financial accounting standards provided pursuant to Section 13(a) of the Exchange Act. ¨
| Item 2.02 | Results of Operations and Financial Condition. |
On July 16, 2025, AAR CORP. (the “Company”) issued a press release and supplemental slide presentation reporting the Company’s financial results for the fourth quarter ended May 31, 2025. Copies of the Company’s press release and supplemental slide presentation are attached hereto as Exhibit 99.1 and Exhibit 99.2, respectively.
The information furnished under Item 2.02 of this Current Report on Form 8-K and the exhibit attached hereto shall not be deemed to be “filed” for the purposes of Section 18 of the Securities Exchange Act of 1934, as amended, or otherwise subject to the liabilities of that section. It may only be incorporated by reference in another filing under the Exchange Act or Securities Act of 1933, as amended, if such subsequent filing specifically references this Form 8-K.
| Item 9.01 | Financial Statements and Exhibits. |
(d) Exhibits.
| Exhibit No. | Description | |
| 99.1 | Press Release issued by AAR CORP. dated July 16, 2025. | |
| 99.2 | Slide Presentation by AAR CORP. dated July 16, 2025. | |
| 104 | Cover Page Interactive Data File (embedded within the Inline XBRL document) |
SIGNATURE
Pursuant to the requirements of the Securities Exchange Act of 1934, the registrant has duly caused this report to be signed on its behalf by the undersigned hereunto duly authorized.
| Date: July 16, 2025 | ||
| AAR CORP. | ||
| By: | ||
| /s/ SEAN M. GILLEN | ||
| Sean M. Gillen | ||
| Senior Vice President and Chief Financial Officer | ||
| (Principal Financial Officer) | ||
Exhibit 99.1
AAR reports fourth quarter and fiscal year 2025 results
Wood Dale, Illinois, July 16, 2025 — AAR CORP. (NYSE: AIR), a leading provider of aviation services to commercial and government operators, MROs, and OEMs, reported today financial results for the fourth quarter and fiscal year 2025 ended May 31, 2025.
FOURTH QUARTER FISCAL YEAR 2025 HIGHLIGHTS
(As compared to Q4 FY2024)
| · | Sales of $755 million; increased 15% |
| · | GAAP EPS of $0.95 |
| · | Adjusted diluted EPS of $1.16; increased 32% |
| · | GAAP Net income of $34 million |
| · | Adjusted EBITDA of $91 million; increased 19% |
| · | Adjusted EBITDA margin increased to 12.4% from 11.6% |
FISCAL YEAR 2025 HIGHLIGHTS
(As compared to FY2024)
| · | Sales of $2.8 billion; increased 20% |
| · | GAAP EPS of $0.35 |
| · | Adjusted diluted EPS of $3.91; increased 17% |
| · | GAAP Net income of $13 million |
| · | Adjusted EBITDA of $324 million; increased 34% |
| · | Adjusted EBITDA margin increased to 11.8% from 10.4% |
“In Fiscal Year 2025, we delivered record sales and profitability and made meaningful progress against our strategic objectives,” said John M. Holmes, AAR’s Chairman, President and Chief Executive Officer. “We substantially completed the integration of the Product Support acquisition and continued to optimize our portfolio with the divestiture of our Landing Gear Overhaul business. We further invested in our fast growing new parts Distribution activities, launched two hangar expansions, and announced several key new business wins for our Trax software solution. We continued to reduce our net leverage, ending the fiscal year at 2.72x. Our optimized portfolio, combined with our strengthened balance sheet, is delivering higher growth, higher margins, and stronger returns.”
1
Holmes continued, “Our fiscal fourth quarter was an extremely strong finish to a record year. We delivered double-digit sales and earnings growth over the prior year quarter. Adjusted sales were up 12% organically due to strong demand across both our commercial and government end-markets. Our new parts Distribution activities continue to lead with an over 20% organic increase in sales driven by both market growth and market share gains. Our Adjusted EBITDA growth of 19% during the quarter reflects continued margin improvement, expanding 80 basis points year-over-year to 12.4%. We see additional opportunities for further margin improvement from sales mix, synergy realization, and other efficiency initiatives.”
RECENT UPDATES
NEW BUSINESS
| · | Implementation of Trax’s eMRO and eMobility solutions across Delta TechOps line maintenance network. |
| · | License agreements for Trax software with Amerijet International Airlines and with SIA Engineering Company’s heavy maintenance facility in Malaysia. |
| · | Our joint venture with KIRA Aviation Services was awarded an E-6B Mercury pilot training contract from the U.S. Navy. |
| · | Signed a new parts Distribution Supply Chain Alliance charter with the U.S. Defense Logistics Agency (DLA). |
PORTFOLIO UPDATE
| · | Substantially completed the integration and site consolidation of the Product Support acquisition. |
| · | Completed the sale of our Landing Gear Overhaul business for $48 million. |
2
FOURTH QUARTER FISCAL YEAR 2025 RESULTS
Consolidated fourth quarter sales increased 15% to $754.5 million, compared to $656.5 million in the same quarter last year. Sales in the fourth quarter of fiscal year 2025 included the sale of certain rotable assets to a significant regional airline customer for $18.7 million in conjunction with the termination of a power-by-the-hour program, which has been excluded from our adjusted sales. Consolidated sales to commercial customers increased 12%, or $56.5 million, primarily due to strong demand for new parts Distribution activities and the rotable asset sale. Sales to government customers increased 21% from the same period last year, primarily due to increased order volume for new parts Distribution activities and double-digit growth in our Integrated Solutions segment. Sales to commercial customers were 69% of consolidated sales, compared to 70% in the prior year quarter.
The Company reported net income of $34.0 million, or $0.95 per share. For the fourth quarter of the prior year, the Company reported net income of $9.1 million, or $0.26 per diluted share. Adjusted diluted earnings per share in the fourth quarter of fiscal year 2025 were $1.16, compared to $0.88 in the fourth quarter of the prior year.
Selling, general, and administrative expenses were $77.4 million in the current quarter, compared to $94.8 million in the prior year quarter. Acquisition, amortization, and integration expenses were $0.3 million in the quarter, compared to $17.1 million in the prior year quarter primarily due to the closing of the Product Support acquisition in the prior year quarter.
Operating margins were 9.7% in the quarter, compared to 5.0% in the prior year quarter. Adjusted operating margin increased to 10.5% in the current year quarter from 9.3% in the prior year quarter, primarily as a result of strong growth and favorable mix in Parts Supply. Sequentially, our adjusted operating margin increased from 9.7% to 10.5%, also driven by the profitability in Parts Supply.
Net interest expense for the quarter was $18.4 million, compared to $18.7 million last year. Average diluted share count increased from 35.4 million shares in the prior year quarter to 35.6 million shares in the current year quarter. We repurchased 0.2 million shares for $10.1 million during the quarter and have $42.5 million remaining on our share repurchase program.
3
Cash flow provided by operating activities was $51.4 million during the current quarter, compared to $24.5 million in the prior year quarter. Excluding the accounts receivable financing program, cash flow provided by operating activities was $50.3 million in the current quarter. As of May 31, 2025, net debt was $880.5 million and net leverage was 2.72x.
Holmes continued, “We are pleased to finish the year with a strong quarter of cash flow generation. We have delivered on our commitment to reduce leverage following the Product Support acquisition. Since the acquisition, our net leverage has decreased from 3.58x to 2.72x. Our financial position is strong and we have a solid foundation for continued capital allocation to drive growth.”
FISCAL YEAR 2025 RESULTS
Full fiscal year 2025 consolidated sales were $2.8 billion, an increase of 20% over fiscal year 2024 with growth resulting from our Product Support acquisition and increased volumes in our new parts distribution activities.
Operating margins were 6.7% for the full year, compared to 5.6% in fiscal year 2024. Adjusted operating margin increased to 9.6% in fiscal year 2025 from 8.3% in fiscal year 2024. The improved adjusted margins are primarily driven by the favorable contribution from the Product Support business and growth in Parts Supply.
Full fiscal year 2025 net income was $12.5 million, or $0.35 per diluted share. Fiscal year 2025 results included after-tax charges of $115.0 million associated with the sale of our Landing Gear Overhaul business and our FCPA settlement and related costs. In fiscal year 2024, net income was $46.3 million, or $1.29 per share. Our adjusted diluted earnings per share was $3.91 in the current year, compared to $3.33 last year, reflecting the impact of our improved operating efficiency on higher sales volumes.
Sales to commercial customers were 71% of consolidated sales in both the current and prior year. Cash flow provided by operating activities was $36.1 million in fiscal year 2025. Excluding our accounts receivable financing program, our cash flow provided by operating activities was $28.5 million in fiscal year 2025.
4
Holmes concluded, “As we enter our fiscal year 2026, we are excited about the opportunities ahead of us. We expect to continue to gain market share in Parts Supply and expand both our capabilities and footprint in Repair & Engineering. We expect Trax to continue its growth trajectory as we win more business and upgrade existing Trax customers to our latest offerings. Additionally, we remain focused on converting our large pipeline of government opportunities to new business wins. We are well-positioned within our markets and expect to drive further growth and margin expansion in our fiscal 2026.”
Conference call information
On Wednesday, July 16, 2025, at 4 p.m. Central time, AAR will hold a conference call to discuss the results. A listen-only webcast and slides can be accessed at https://edge.media-server.com/mmc/p/wmgmvczc. Participants may join via phone by registering at https://register-conf.media-server.com/register/BIba14a44bd46347d0859eb66582d4e484. Once registered, participants will receive a dial-in number and a unique PIN that will allow them to access the call.
A replay of the conference call will be available for on-demand listening shortly after the completion of the call at the webcast link and will remain available for approximately one year.
The slides are also available on AAR’s website at https://www.aarcorp.com/en/investors/events-and-presentations/.
About AAR
AAR is a global aerospace and defense aftermarket solutions company with operations in over 20 countries. Headquartered in the Chicago area, AAR supports commercial and government customers through four operating segments: Parts Supply, Repair & Engineering, Integrated Solutions, and Expeditionary Services. Additional information can be found at aarcorp.com/.
Contact: Investor Relations | +1-630-227-5830 | investors@aarcorp.com
5
This press release contains certain statements relating to future results, which are forward-looking statements as that term is defined in the Private Securities Litigation Reform Act of 1995, which reflect management’s expectations about future conditions, including, but not limited to, continued demand in the commercial and government aviation markets; market position; anticipated activities and benefits related to new or expanding business relationships; contributions from acquisitions; expansion of capabilities and operational footprint; opportunities for margin improvement through operations, integration activities and other efficiency initiatives; and continued sales growth, earnings performance, debt management, and capital allocation.
Forward-looking statements often address our expected future operating and financial performance and financial condition, or targets, goals, commitments, and other business plans, and often may also be identified because they contain words such as “anticipate,” “believe,” “continue,” “could,” “estimate,” “expect,” “intend,” “likely,” “may,” “might,” “plan,” “potential,” “predict,” “project,” “seek,” “should,” “target,” “will,” “would,” or similar expressions and the negatives of those terms.
These forward-looking statements are based on the beliefs of Company management, as well as assumptions and estimates based on information available to the Company as of the dates such assumptions and estimates are made, and are subject to certain risks and uncertainties that could cause actual results to differ materially from historical results or those anticipated, depending on a variety of factors, including: (i) factors that adversely affect the commercial aviation industry; (ii) adverse events and negative publicity in the aviation industry; (iii) a reduction in sales to the U.S. government and its contractors; (iv) cost overruns and losses on fixed-price contracts; (v) nonperformance by subcontractors or suppliers; (vi) our ability to manage our operational footprint; (vii) a reduction in outsourcing of maintenance activity by airlines; (viii) a shortage of skilled personnel or work stoppages; (ix) competition from other companies; (x) financial, operational and legal risks arising as a result of operating internationally; (xi) inability to integrate acquisitions effectively and execute operational and financial plans related to the acquisitions; (xii) failure to realize the anticipated benefits of acquisitions; (xiii) circumstances associated with divestitures; (xiv) inability to recover costs due to fluctuations in market values for aviation products and equipment; (xv) cyber or other security threats or disruptions; (xvi) a need to make significant capital expenditures to keep pace with technological developments in our industry; (xvii) restrictions on use of intellectual property and tooling important to our business; (xviii) inability to fully execute our stock repurchase program and return capital to stockholders; (xix) limitations on our ability to access the debt and equity capital markets or to draw down funds under loan agreements; (xx) our ability to manage our debt; (xxi) non-compliance with restrictive and financial covenants contained in our debt and loan agreements; (xxii) changes in or non-compliance with laws and regulations related to federal contractors, the aviation industry, international operations, safety, and environmental matters, and the costs of complying with such laws and regulations; and (xxiii) exposure to product liability and property claims that may be in excess of our liability insurance coverage. Should one or more of those risks or uncertainties materialize adversely, or should underlying assumptions or estimates prove incorrect, actual results may vary materially from those described.
For a discussion of these and other risks and uncertainties, refer to our Annual Report on Form 10-K, Part I, “Item 1A, Risk Factors” and our other filings filed from time to time with the U.S Securities and Exchange Commission. These events and uncertainties are difficult or impossible to predict accurately and many are beyond the Company’s control. The risks described in these reports are not the only risks we face, as additional risks and uncertainties are not currently known or foreseeable or impossible to predict accurately or risks that are beyond the Company’s control or deemed immaterial may materially adversely affect our business, financial condition or results of operations in future periods. We assume no obligation to update any forward-looking statements to reflect events or circumstances after the date of such statements or to reflect the occurrence of anticipated or unanticipated events, except as required by law.
6
AAR CORP. and subsidiaries
Condensed consolidated statements of income (In millions except per share data - unaudited) |
Three months ended May 31, |
Year ended May 31, | ||||||||||||||
| 2025 | 2024 | 2025 | 2024 | |||||||||||||
| Sales | $ 754.5 | $ 656.5 | $ 2,780.5 | $ 2,318.9 | ||||||||||||
| Cost of sales | 604.3 | 529.2 | 2,252.8 | 1,876.6 | ||||||||||||
| Gross profit | 150.2 | 127.3 | 527.7 | 442.3 | ||||||||||||
| Provision for credit losses | 0.5 | 0.2 | 0.2 | 0.7 | ||||||||||||
| Selling, general, and administrative | 77.4 | 94.8 | 347.7 | 312.2 | ||||||||||||
| Earnings (Loss) from joint ventures | 0.7 | 0.3 | 5.4 | (0.2 | ) | |||||||||||
| Operating income | 73.0 | 32.6 | 185.2 | 129.2 | ||||||||||||
| Losses related to sale and exit of business, net | (7.1 | ) | (0.2 | ) | (72.4 | ) | (2.8 | ) | ||||||||
| Pension settlement charge | –– | –– | –– | (26.7 | ) | |||||||||||
| Interest expense, net | (18.4 | ) | (18.7 | ) | (73.6 | ) | (41.0 | ) | ||||||||
| Other income (expense), net | 0.1 | (0.1 | ) | (0.3 | ) | (0.4 | ) | |||||||||
| Income before income tax expense | 47.6 | 13.6 | 38.9 | 58.3 | ||||||||||||
| Income tax expense | 13.6 | 4.5 | 26.4 | 12.0 | ||||||||||||
| Net income | $ 34.0 | $ 9.1 | $ 12.5 | $ 46.3 | ||||||||||||
| Earnings per share – Basic | $ 0.95 | $ 0.26 | $ 0.35 | $ 1.30 | ||||||||||||
| Earnings per share – Diluted | $ 0.95 | $ 0.26 | $ 0.35 | $1.29 | ||||||||||||
| Share data used for earnings per share: | ||||||||||||||||
| Weighted average shares outstanding – Basic | 35.4 | 35.1 | 35.6 | 35.1 | ||||||||||||
| Weighted average shares outstanding – Diluted | 35.6 | 35.4 | 35.8 | 35.4 | ||||||||||||
7
AAR CORP. and subsidiaries
|
Condensed consolidated balance sheets (In millions) |
May 31, 2025 |
May 31, 2024 | |
| (unaudited) | |||
| ASSETS | |||
| Cash and cash equivalents | $ 96.5 | $ 85.8 | |
| Restricted cash | 12.7 | 10.3 | |
| Accounts receivable, net | 354.8 | 287.2 | |
| Contract assets | 140.3 | 123.2 | |
| Inventories, net | 809.2 | 733.1 | |
| Rotable assets and equipment on or available for lease | 38.3 | 81.5 | |
| Other current assets | 58.8 | 68.5 | |
| Total current assets | 1,510.6 | 1,389.6 | |
| Property, plant, and equipment, net | 158.5 | 171.7 | |
| Goodwill and intangible assets, net | 750.4 | 790.2 | |
| Rotable assets supporting long-term programs | 172.4 | 166.3 | |
| Operating lease right-of-use assets, net | 93.3 | 96.6 | |
| Other non-current assets | 159.4 | 155.6 | |
| Total assets | $ 2,844.6 | $ 2,770.0 | |
| LIABILITIES AND EQUITY | |||
| Accounts payable | $ 303.1 | $ 238.0 | |
| Other current liabilities | 251.6 | 228.9 | |
| Total current liabilities | 554.7 | 466.9 | |
| Long-term debt | 968.0 | 985.4 | |
| Operating lease liabilities | 79.6 | 80.3 | |
| Other liabilities and deferred revenue | 30.7 | 47.6 | |
| Total liabilities | 1,633.0 | 1,580.2 | |
| Equity | 1,211.6 | 1,189.8 | |
| Total liabilities and equity | $ 2,844.6 | $ 2,770.0 |
8
AAR CORP. and subsidiaries
Condensed consolidated statements of cash flows (In millions – unaudited) | Three months May 31, | Year ended May 31, | ||||||||||||||
| 2025 | 2024 | 2025 | 2024 | |||||||||||||
| Cash flows provided by operating activities: | ||||||||||||||||
| Net income | $ 34.0 | $ 9.1 | $ 12.5 | $ 46.3 | ||||||||||||
| Adjustments to reconcile income to net cash provided by operating activities: | ||||||||||||||||
| Depreciation and amortization | 14.3 | 15.3 | 57.8 | 41.2 | ||||||||||||
| Stock-based compensation expense | 4.3 | 3.8 | 19.9 | 15.3 | ||||||||||||
| Loss on sale of business | 5.9 | –– | 68.9 | –– | ||||||||||||
| Pension settlement charge | –– | –– | –– | 26.7 | ||||||||||||
| Changes in certain assets and liabilities: | ||||||||||||||||
| Accounts receivable | (40.6 | ) | 12.0 | (82.8 | ) | (5.3 | ) | |||||||||
| Contract assets | 11.2 | (17.6 | ) | (26.6 | ) | (17.1 | ) | |||||||||
| Inventories | (32.7 | ) | 6.9 | (109.3 | ) | (90.4 | ) | |||||||||
| Rotable assets and equipment on or available for short-term lease | 0.7 | 12.6 | 4.7 | (11.2 | ) | |||||||||||
| Prepaid expenses and other current assets | 6.4 | (9.2 | ) | (10.5 | ) | (20.5 | ) | |||||||||
| Rotable assets supporting long-term programs | 0.3 | 9.4 | (23.9 | ) | 2.5 | |||||||||||
| Accounts payable and accrued liabilities | 39.9 | (17.2 | ) | 111.4 | 76.3 | |||||||||||
| Other | 7.7 | (0.6 | ) | 14.0 | (20.0 | ) | ||||||||||
| Net cash provided by operating activities – continuing operations | 51.4 | 24.5 | 36.1 | 43.8 | ||||||||||||
| Net cash used in operating activities – discontinued operations | –– | –– | –– | (0.2 | ) | |||||||||||
| Net cash provided by operating activities | 51.4 | 24.5 | 36.1 | 43.6 | ||||||||||||
| Cash flows provided by (used in) investing activities: | ||||||||||||||||
| Property, plant, and equipment expenditures | (10.0 | ) | (7.5 | ) | (34.7 | ) | (29.7 | ) | ||||||||
| Acquisitions, net of cash acquired | (4.4 | ) | (722.9 | ) | (1.5 | ) | (722.9 | ) | ||||||||
| Proceeds from sale of business | 48.0 | –– | 48.0 | –– | ||||||||||||
| Other | (6.0 | ) | (1.3 | ) | (1.1 | ) | (5.9 | ) | ||||||||
| Net cash provided by (used in) investing activities | 27.6 | (731.7 | ) | 10.7 | (758.5 | ) | ||||||||||
| Cash flows provided by (used in) financing activities: | ||||||||||||||||
| Short-term borrowings, net | (55.0 | ) | 170.0 | (20.0 | ) | 175.0 | ||||||||||
| Purchase of treasury stock | (10.1 | ) | –– | (10.1 | ) | (5.1 | ) | |||||||||
| Proceeds from long-term borrowings | –– | 550.0 | –– | 550.0 | ||||||||||||
| Other | (5.6 | ) | (0.3 | ) | (3.6 | ) | 9.3 | |||||||||
| Net cash provided by (used in) financing activities | (70.7 | ) | 719.7 | (33.7 | ) | 729.2 | ||||||||||
| Increase in cash and cash equivalents | 8.3 | 12.5 | 13.1 | 14.3 | ||||||||||||
| Cash, cash equivalents, and restricted cash at beginning of period | 100.9 | 83.6 | 96.1 | 81.8 | ||||||||||||
| Cash, cash equivalents, and restricted cash at end of period | $109.2 | $ 96.1 | $ 109.2 | $ 96.1 | ||||||||||||
9
AAR CORP. and subsidiaries
Third-party sales by segment (In millions – unaudited) | Three months ended May 31, | Year ended May 31, | ||||||||||||||
| 2025 | 2024 | 2025 | 2024 | |||||||||||||
| Parts Supply | $ 305.5 | $ 260.3 | $ 1,099.6 | $ 967.0 | ||||||||||||
| Repair & Engineering | 222.6 | 216.4 | 884.9 | 640.1 | ||||||||||||
| Integrated Solutions | 200.1 | 163.5 | 695.3 | 641.9 | ||||||||||||
| Expeditionary Services | 26.3 | 16.3 | 100.7 | 69.9 | ||||||||||||
| $ 754.5 | $ 656.5 | $ 2,780.5 | $ 2,318.9 | |||||||||||||
Operating income (loss) by segment (In millions – unaudited) | Three months ended May 31, | Year ended May 31, | ||||||||||||||
| 2025 | 2024 | 2025 | 2024 | |||||||||||||
| Parts Supply | $ 49.7 | $ 35.2 | $ 156.8 | $ 109.8 | ||||||||||||
| Repair & Engineering | 18.3 | 20.6 | 81.2 | 52.5 | ||||||||||||
| Integrated Solutions | 12.6 | 1.2 | 36.4 | 23.9 | ||||||||||||
| Expeditionary Services | 3.2 | 0.4 | 10.1 | 3.5 | ||||||||||||
| 83.8 | 57.4 | 284.5 | 189.7 | |||||||||||||
| Corporate and other | (10.8 | ) | (24.8 | ) | (99.3 | ) | (60.5 | ) | ||||||||
| $ 73.0 | $ 32.6 | $ 185.2 | $ 129.2 | |||||||||||||
Adjusted net income, adjusted diluted earnings per share, adjusted operating margin, adjusted cash flow provided by operating activities, adjusted EBITDA, adjusted EBITDA margin, net debt, and net debt to adjusted EBITDA (net leverage) are “non-GAAP financial measures” as defined in Regulation G of the Securities Exchange Act of 1934, as amended (the “Exchange Act”). We believe these non-GAAP financial measures are relevant and useful for investors as they illustrate our core operating performance, cash flows, and leverage unaffected by the impact of certain items that management does not believe are indicative of our ongoing and core operating activities. When reviewed in conjunction with our GAAP results and the accompanying reconciliations, we believe these non-GAAP financial measures provide additional information that is useful to gain an understanding of the factors and trends affecting our business and provide a means by which to compare our operating performance and leverage against that of other companies in the industries we compete. These non-GAAP measures should be considered as a supplement to, and not as a substitute for, or superior to, the corresponding measures calculated in accordance with GAAP.
Our non-GAAP financial measures reflect adjustments for certain items including, but not limited to, the following:
| · | Costs associated with U.S. Foreign Corrupt Practices Act (“FCPA”) matters that we self-reported to the U.S. Department of Justice and other agencies, including investigation costs and settlement charges. |
| · | Expenses associated with recent acquisition activity, including professional fees for legal, due diligence, and other acquisition activities, bridge financing fees, intangible asset amortization, integration costs, and compensation expense related to contingent consideration and retention agreements. |
| · | Pension settlement charges associated with the settlement and termination of our frozen defined benefit pension plan. |
| · | Legal judgments related to or impacted by the Russia/Ukraine conflict. |
| · | Contract termination/restructuring costs comprised of gains and losses that are recognized at the time of modifying, terminating, or restructuring certain customer and vendor contracts, including the impact from the U.S. government exercising their termination for convenience in the first quarter of fiscal year 2025 for our Mobility Systems business’s new-generation pallet contract. |
| · | Losses related to our exit from our Indian joint venture, our Landing Gear Overhaul business, and our Composites manufacturing business, including legal fees for the performance guarantee associated with the Composites’ A220 aircraft contract. |
10
Adjusted EBITDA is net income before interest income (expense), other income (expense), income taxes, depreciation and amortization, stock-based compensation, and items of an unusual nature including but not limited to business divestitures and acquisitions, FCPA investigation, settlement and remediation compliance costs, pension settlement charges, certain legal judgments, acquisition, integration, and amortization expenses from recent acquisition activity, and significant customer contract terminations.
Pursuant to the requirements of Regulation G of the Exchange Act, we are providing the following tables that reconcile the above-mentioned non-GAAP financial measures to the most directly comparable GAAP financial measures:
Adjusted net income (In millions – unaudited) |
Three months ended May 31, |
Year ended May 31, |
||||||||||||||
| 2025 | 2024 | 2025 | 2024 | |||||||||||||
| Net income | $ 34.0 | $ 9.1 | $ 12.5 | $ 46.3 | ||||||||||||
| Acquisition, integration, and amortization expenses | 3.1 | 18.6 | 26.7 | 42.8 | ||||||||||||
| Losses related to sale and exit of business/joint venture, net | 7.1 | 0.2 | 70.3 | 2.8 | ||||||||||||
| Government COVID-related subsidy liability | 0.8 | –– | 0.8 | –– | ||||||||||||
| FCPA settlement and investigation costs | –– | 4.8 | 65.3 | 10.5 | ||||||||||||
| Russian bankruptcy court judgment (reversal) | –– | –– | (11.1 | ) | 11.2 | |||||||||||
| Contract termination cost | –– | 4.8 | 0.2 | 4.8 | ||||||||||||
| Pension settlement charge | –– | –– | –– | 26.7 | ||||||||||||
| Severance charges | –– | 0.5 | –– | 0.5 | ||||||||||||
| Tax effect on adjustments (a) | (3.5 | ) | (6.7 | ) | (25.1 | ) | (27.2 | ) | ||||||||
| Adjusted net income | $ 41.5 | $ 31.3 | $ 139.6 | $ 118.4 | ||||||||||||
| (a) | Calculation uses estimated statutory tax rates on non-GAAP adjustments except for the impact of the non-deductible portion of the FCPA settlement charge and the tax effect of the pension settlement charge, which includes income taxes previously recognized in accumulated other comprehensive loss. |
Adjusted diluted earnings per share (unaudited) |
Three months ended May 31, |
Year ended May 31, |
||||||||||||||
| 2025 | 2024 | 2025 | 2024 | |||||||||||||
| Diluted earnings per share | $ 0.95 | $ 0.26 | $ 0.35 | $ 1.29 | ||||||||||||
| Acquisition, integration, and amortization expenses | 0.09 | 0.52 | 0.74 | 1.21 | ||||||||||||
| Losses related to sale and exit of business/joint venture, net | 0.20 | 0.01 | 1.97 | 0.07 | ||||||||||||
| Government COVID-related subsidy liability | 0.02 | –– | 0.02 | –– | ||||||||||||
| FCPA settlement and investigation costs | –– | 0.14 | 1.84 | 0.29 | ||||||||||||
| Russian bankruptcy court judgment (reversal) | –– | –– | (0.31 | ) | 0.32 | |||||||||||
| Contract termination cost | –– | 0.14 | –– | 0.14 | ||||||||||||
| Pension settlement charge | –– | –– | –– | 0.76 | ||||||||||||
| Severance charges | –– | 0.01 | –– | 0.01 | ||||||||||||
| Tax effect on adjustments (a) | (0.10 | ) | (0.20 | ) | (0.70 | ) | (0.76 | ) | ||||||||
| Adjusted diluted earnings per share | $ 1.16 | $ | 0.88 | $ 3.91 | $ 3.33 | |||||||||||
| (a) | Calculation uses estimated statutory tax rates on non-GAAP adjustments except for the impact of the non-deductible portion of the FCPA settlement charge and the tax effect of the pension settlement charge, which includes income taxes previously recognized in accumulated other comprehensive loss. |
11
Adjusted operating margin (In millions - unaudited) | Three months ended | Year ended | ||||||||||||||||||
| May 31, 2025 | February 28, 2025 | May 31, 2024 | May 31, 2025 | May 31, 2024 | ||||||||||||||||
| Sales | $ 754.5 | $ 678.2 | $ 656.5 | $ 2,780.5 | $ 2,318.9 | |||||||||||||||
| Contract termination/restructuring costs | (18.7 | ) | (4.0 | ) | 2.3 | (32.2 | ) | 2.3 | ||||||||||||
| Adjusted sales | $ 735.8 | $ 674.2 | $ 658.8 | $ 2,748.3 | $ 2,321.2 | |||||||||||||||
| Operating income | $ 73.0 | $ 71.1 | $ 32.6 | $185.2 | $ 129.2 | |||||||||||||||
| Acquisition, integration and amortization expenses | 3.1 | 7.5 | 18.6 | 26.8 | 36.7 | |||||||||||||||
| Government COVID-related subsidy liability | 0.8 | –– | –– | 0.8 | –– | |||||||||||||||
| Gain related to sale of joint venture | –– | –– | –– | (2.1 | ) | –– | ||||||||||||||
| FCPA settlement and investigation costs | –– | 1.1 | 4.8 | 65.3 | 10.5 | |||||||||||||||
| Contract termination/restructuring costs and loss provisions, net | –– | (3.0 | ) | 4.8 | 0.2 | 4.8 | ||||||||||||||
| Russian bankruptcy court judgment (reversal) | –– | (11.1 | ) | –– | (11.1 | ) | 11.2 | |||||||||||||
| Severance charges | –– | –– | 0.5 | –– | 0.5 | |||||||||||||||
| Adjusted operating income | $ 76.9 | $ 65.6 | $ 61.3 | $ 265.1 | $ 192.9 | |||||||||||||||
| Operating margin | 9.7% | 10.5% | 5.0% | 6.7% | 5.6% | |||||||||||||||
| Adjusted operating margin | 10.5% | 9.7% | 9.3% | 9.6% | 8.3% | |||||||||||||||
Adjusted cash flow provided by operating activities (In millions – unaudited) | Three months May 31, | Year ended May 31, | ||||||||||||||
| 2025 | 2024 | 2025 | 2024 | |||||||||||||
| Cash flow provided by operating activities | $ 51.4 | $ 24.5 | $ 36.1 | $ 43.8 | ||||||||||||
| Amounts outstanding on accounts receivable financing program: | ||||||||||||||||
| Beginning of period | 20.2 | 13.7 | 13.7 | 12.8 | ||||||||||||
| End of period | (21.3 | ) | (13.7 | ) | (21.3 | ) | (13.7 | ) | ||||||||
| Adjusted cash flow provided by operating activities | $ 50.3 | $ 24.5 | $ 28.5 | $ 42.9 | ||||||||||||
12
Adjusted EBITDA (In millions - unaudited) | Three months ended May 31, | Year ended May 31, | ||||||||||||||
| 2025 | 2024 | 2025 | 2024 | |||||||||||||
| Net income | $ 34.0 | $ 9.1 | $ 12.5 | $ 46.3 | ||||||||||||
| Income tax expense | 13.6 | 4.5 | 26.4 | 12.0 | ||||||||||||
| Other (income) expense, net | (0.1 | ) | 0.1 | 0.3 | 0.4 | |||||||||||
| Interest expense, net | 18.4 | 18.7 | 73.6 | 41.0 | ||||||||||||
| Depreciation and amortization | 13.7 | 15.3 | 55.2 | 41.2 | ||||||||||||
| Acquisition and integration expenses (benefit) | (0.9 | ) | 14.6 | 10.8 | 29.7 | |||||||||||
| Government COVID-related subsidy liability | 0.8 | –– | 0.8 | –– | ||||||||||||
| FCPA settlement and investigation costs | –– | 4.8 | 65.3 | 10.5 | ||||||||||||
| Losses related to sale and exit of business/joint venture, net | 7.1 | 0.2 | 70.3 | 2.8 | ||||||||||||
| Russian bankruptcy court judgment (reversal) | –– | –– | (11.1 | ) | 11.2 | |||||||||||
| Contract termination/restructuring costs, net | –– | 4.8 | 0.2 | 4.8 | ||||||||||||
| Severance charges | –– | 0.5 | –– | 0.5 | ||||||||||||
| Pension settlement charge | –– | –– | –– | 26.7 | ||||||||||||
| Stock-based compensation | 4.3 | 3.8 | 19.9 | 15.3 | ||||||||||||
| Adjusted EBITDA | $ 90.9 | $ 76.4 | $ 324.2 | $ 242.4 | ||||||||||||
| Net income margin | 4.5% | 1.4% | 0.4% | 2.0% | ||||||||||||
| Adjusted EBITDA margin | 12.4% | 11.6% | 11.8% | 10.4% | ||||||||||||
Net debt (In millions – unaudited) | May 31, 2025 | May 31, 2024 | ||||||
| Total debt | $ 977.0 | $ 997.0 | ||||||
| Less: Cash and cash equivalents | (96.5 | ) | (85.8 | ) | ||||
| Net debt | $ 880.5 | $ 911.2 | ||||||
Net debt to adjusted EBITDA (In millions - unaudited) | May 31, 2025 | May 31, 2024 | ||||||
| Adjusted EBITDA for the year ended | $ 324.2 | $ 242.4 | ||||||
| Net debt at year end | 880.5 | 911.2 | ||||||
| Net debt to Adjusted EBITDA | 2.72 | 3.76 | ||||||
13
Exhibit 99.2

© 2025 AAR CORP. All rights reserved worldwide. 1 Fourth Quarter Fiscal Year 2025 Earnings Call July 16, 2025
© 2025 AAR CORP. All rights reserved worldwide. 2 Note : All results and expectations in the presentation reflect continuing operations unless otherwise noted . This presentation contain s certain statements relating to future results, which are forward - looking statements as that term is defined in the Private Securities Litigation Reform Act of 1995 , which reflect management’s expectations about future conditions , including, but not limited to, continued demand in the commercial and government aviation markets, anticipated activities and benefits under extended, expanded and new services, supply and distribution agreements, contributions from our acquisitions, production efficiencies in our hangars and progress on hangar expansions, continued sales growth, margin expansion, debt management, capital allocation and expenses . These forward - looking statements are based on the beliefs of Company management, as well as assumptions and estimates based on information available to the Company as of the dates such assumptions and estimates are made, and are subject to certain risks and uncertainties that could cause actual results to differ materially from historical results or those anticipated, depending on a variety of factors, including : ( i ) factors that adversely affect the commercial aviation industry ; (ii) adverse events and negative publicity in the aviation industry ; (iii) a reduction in sales to the U . S . government and its contractors ; (iv) cost overruns and losses on fixed - price contracts ; (v) nonperformance by subcontractors or suppliers ; (vi) our ability to manage our operational footprint ; (vii) a reduction in outsourcing of maintenance activity by airlines ; (viii) a shortage of skilled personnel or work stoppages ; (ix) competition from other companies ; (x) financial, operational and legal risks arising as a result of operating internationally ; (xi) inability to integrate acquisitions effectively and execute operational and financial plans related to the acquisitions ; (xii) failure to realize the anticipated benefits of acquisitions ; (xiii) circumstances associated with divestitures ; (xiv) inability to recover costs due to fluctuations in market values for aviation products and equipment ; (xv) cyber or other security threats or disruptions ; (xvi) a need to make significant capital expenditures to keep pace with technological developments in our industry ; (xvii) restrictions on use of intellectual property and tooling important to our business ; (xviii) inability to fully execute our stock repurchase program and return capital to stockholders ; (xix) limitations on our ability to access the debt and equity capital markets or to draw down funds under loan agreements ; (xx) our ability to manage our debt ; (xxi) non - compliance with restrictive and financial covenants contained in our debt and loan agreements ; (xxii) changes in or non - compliance with laws and regulations related to federal contractors, the aviation industry, international operations, safety, and environmental matters, and the costs of complying with such laws and regulations ; and (xxiii) exposure to product liability and property claims that may be in excess of our liability insurance coverage . Should one or more of those risks or uncertainties materialize adversely, or should underlying assumptions or estimates prove incorrect, actual results may vary materially from those described . For a discussion of these and other risks and uncertainties, refer to our Annual Report on Form 10 - K, Part I, “Item 1 A, Risk Factors” and our other filings filed from time to time with the U . S . Securities and Exchange Commission . We assume no obligation to update any forward - looking statements to reflect events or circumstances after the date of such statements or to reflect the occurrence of anticipated or unanticipated events , except as required by law . Non - GAAP Financial Measures : This presentation includes certain non - GAAP financial measures . Please refer to the Appendix for additional information on these non - GAAP financial measures and reconciliations to the most directly comparable GAAP financial measures . Unless otherwise noted, the statements made and the information provided in this presentation are as of July 16 , 202 5 . Forward - looking Statements
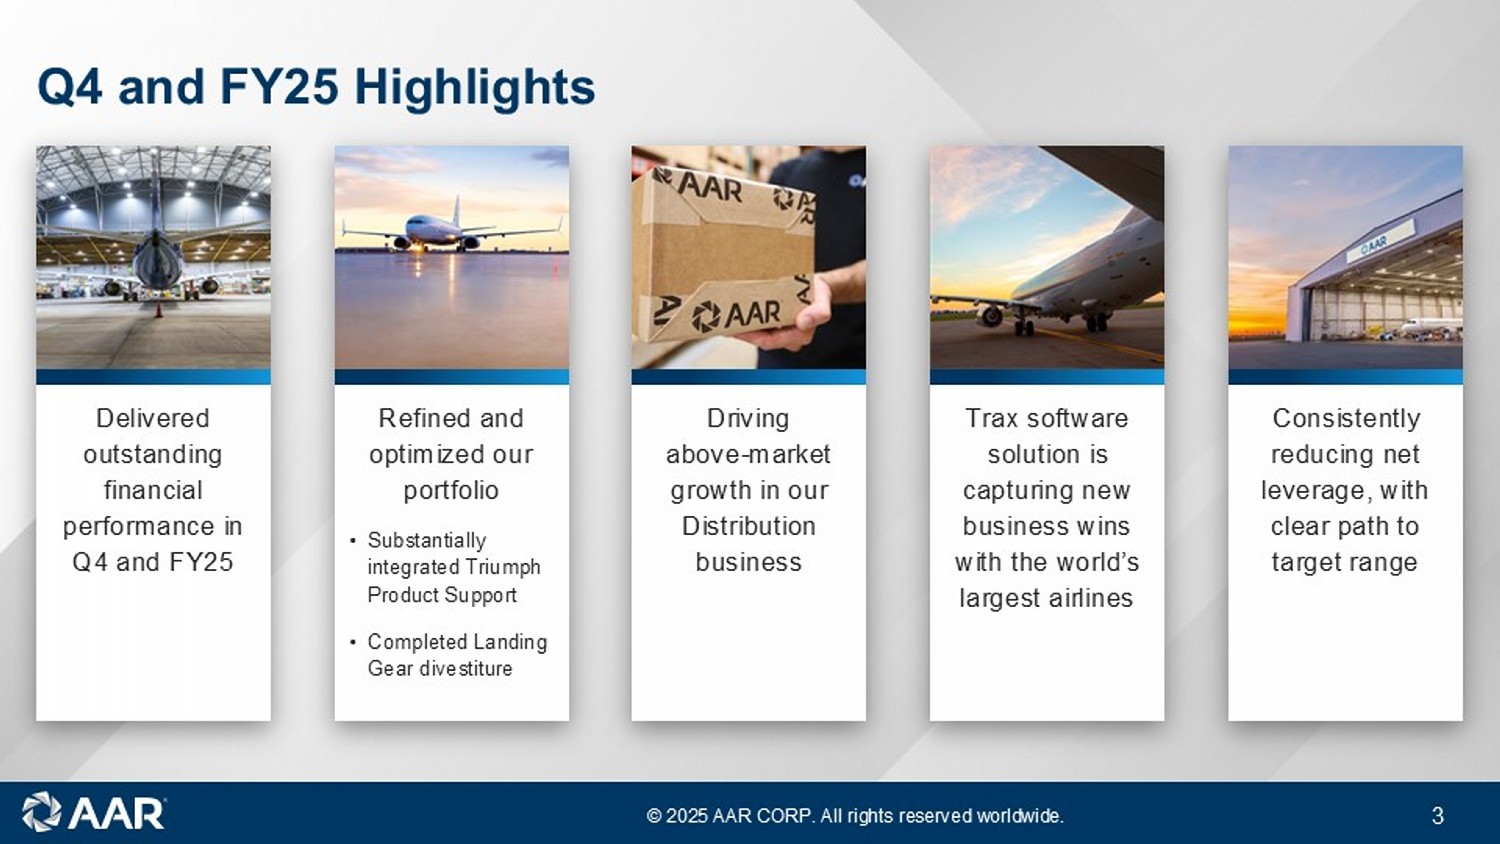
© 2025 AAR CORP. All rights reserved worldwide. 3 Q4 and FY25 Highlights © 2025 AAR CORP. All rights reserved worldwide. 3 Driving above - market growth in our Distribution business Refined and optimized our portfolio • Substantially integrated Triumph Product Support • Completed Landing Gear divestiture Delivered outstanding financial performance in Q4 and FY25 Trax software solution is capturing new business wins with the world’s largest airlines Consistently reducing net leverage, with clear path to target range
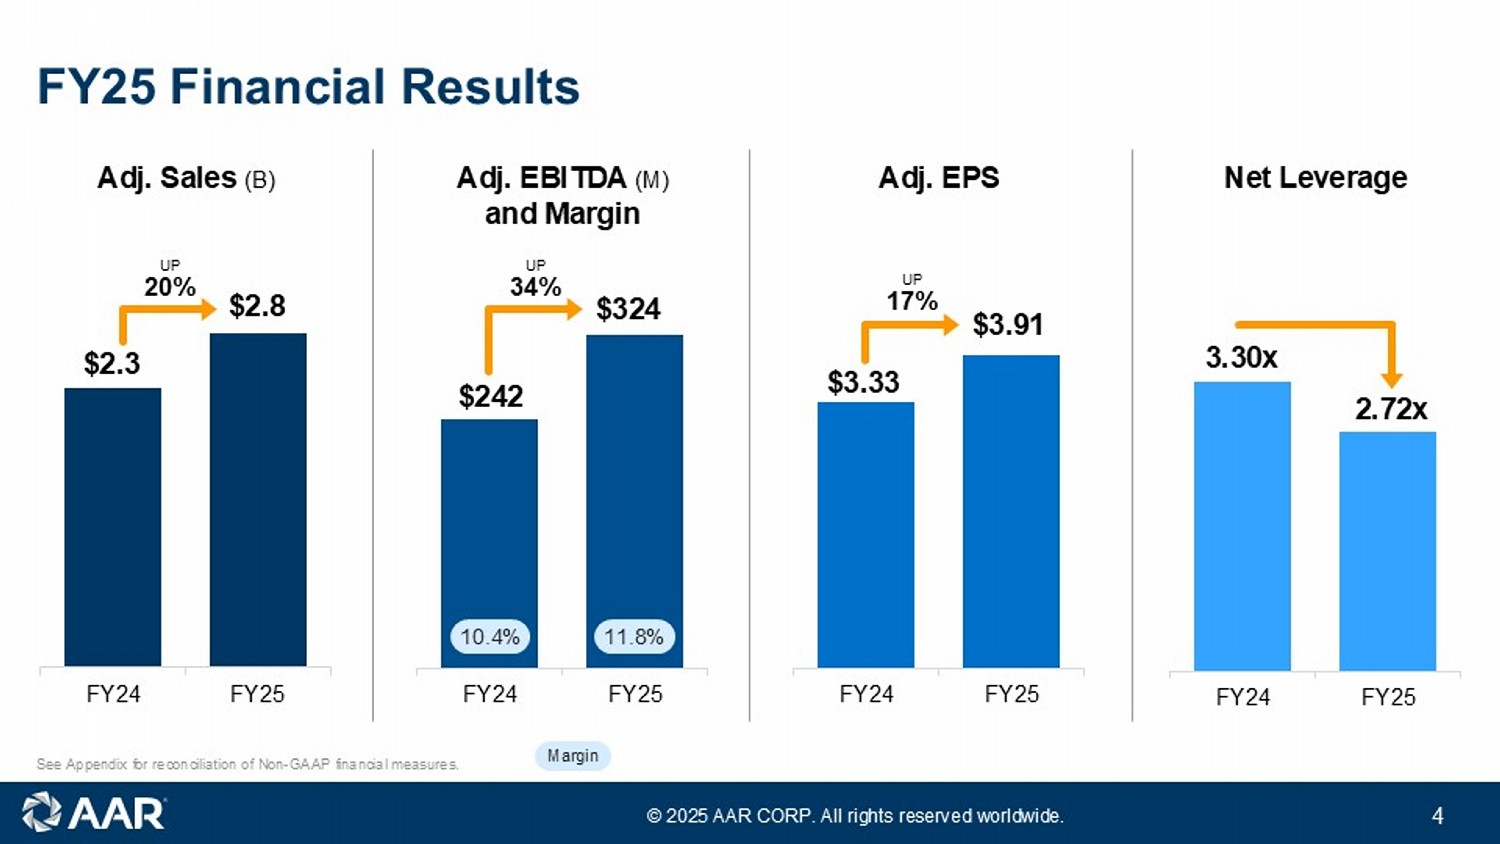
© 2025 AAR CORP. All rights reserved worldwide. 4 FY24 FY25 $2.3 $2.8 FY24 FY25 $242 $324 FY24 FY25 $3.33 $3.91 FY24 FY25 3.30x 2.72x Adj. Sales (B) Adj. EBITDA (M) and Margin Adj. EPS Net Leverage See Appendix for reconciliation of Non - GAAP financial measures. FY25 Financial Results 11.8% 10.4% UP 20% UP 34% UP 17% Margin
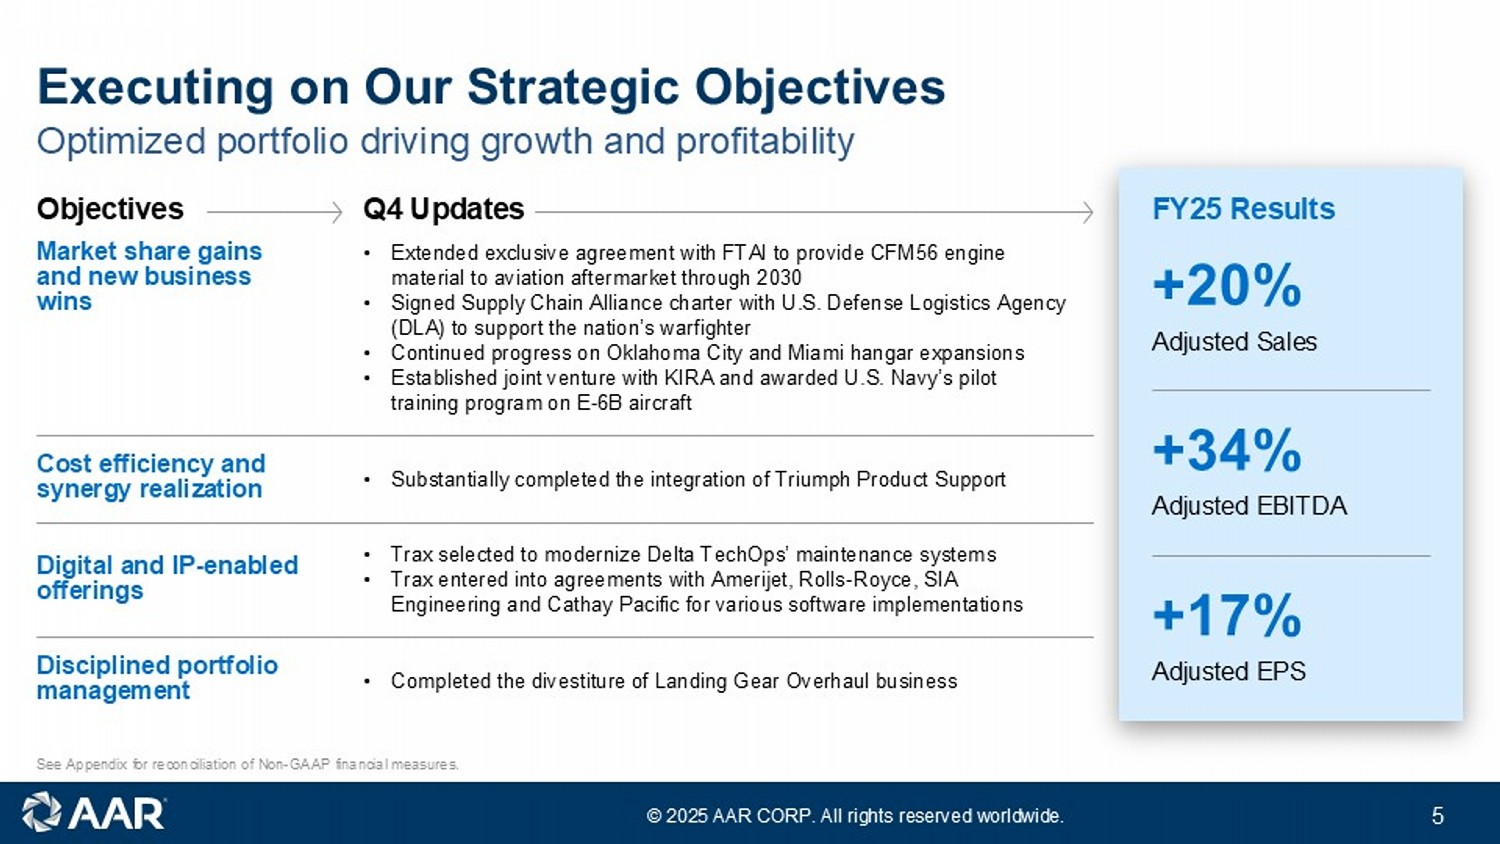
© 2025 AAR CORP. All rights reserved worldwide. 5 Optimized portfolio driving growth and profitability Executing on Our Strategic Objectives See Appendix for reconciliation of Non - GAAP financial measures. Objectives Market share gains and new business wins • Extended exclusive agreement with FTAI to provide CFM56 engine material to aviation aftermarket through 2030 • Signed Supply Chain Alliance charter with U.S. Defense Logistics Agency (DLA) to support the nation’s warfighter • Continued progress on Oklahoma City and Miami hangar expansions • Established joint venture with KIRA and awarded U.S. Navy’s pilot training program on E - 6B aircraft Cost efficiency and synergy realization • Substantially completed the integration of Triumph Product Support Digital and IP - enabled offerings • Trax selected to modernize Delta TechOps’ maintenance systems • Trax entered into agreements with Amerijet , Rolls - Royce, SIA Engineering and Cathay Pacific for various software implementations Disciplined portfolio management • Completed the divestiture of Landing Gear Overhaul business Q4 Updates FY25 Results +20% Adjusted Sales +34% Adjusted EBITDA +17% Adjusted EPS
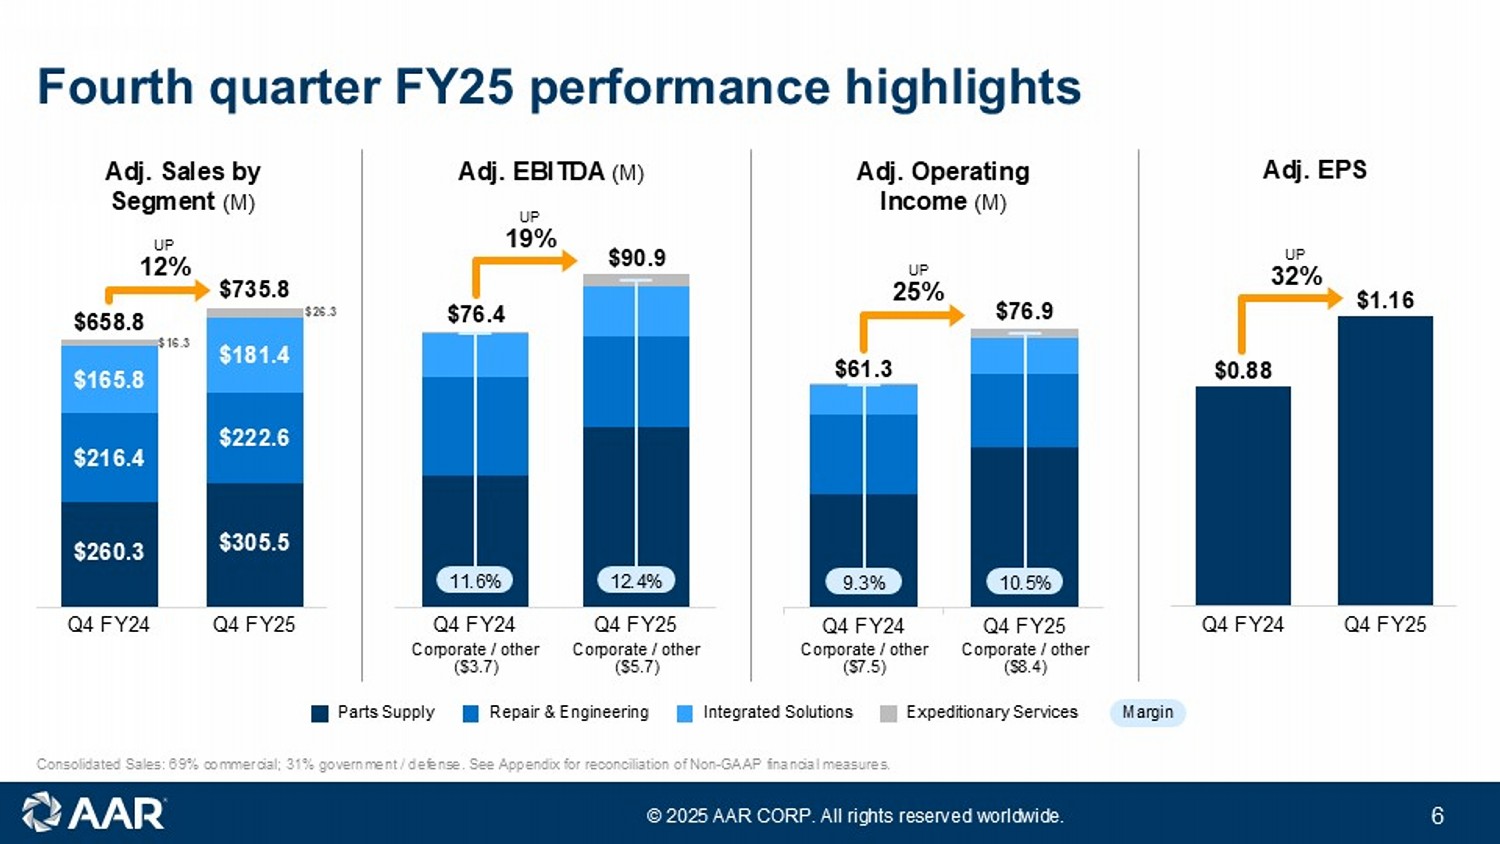
© 2025 AAR CORP. All rights reserved worldwide. 6 Fourth quarter FY25 performance highlights Consolidated Sales: 69% commercial; 31% government / defense. See Appendix for reconciliation of Non - GAAP financial measures. Q4 FY24 Q4 FY25 Adj. EPS $0.88 $1.16 Parts Supply Integrated Solutions Repair & Engineering Expeditionary Services Margin Q4 FY24 Q4 FY25 $658.8 $735.8 Adj. Sales by Segment (M) $165.8 $181.4 $216.4 $222.6 $260.3 $305.5 $16.3 $26.3 Q4 FY24 Q4 FY25 Adj. Operating Income (M) Corporate / other ($ 7.5 ) Corporate / other ($ 8.4 ) $61.3 $76.9 10.5% 9.3% Q4 FY24 Q4 FY25 Corporate / other ($3.7) Corporate / other ($5.7) Adj. EBITDA (M) 12.4% 11.6% $76.4 $90.9 UP 12% UP 19% UP 25% UP 32%
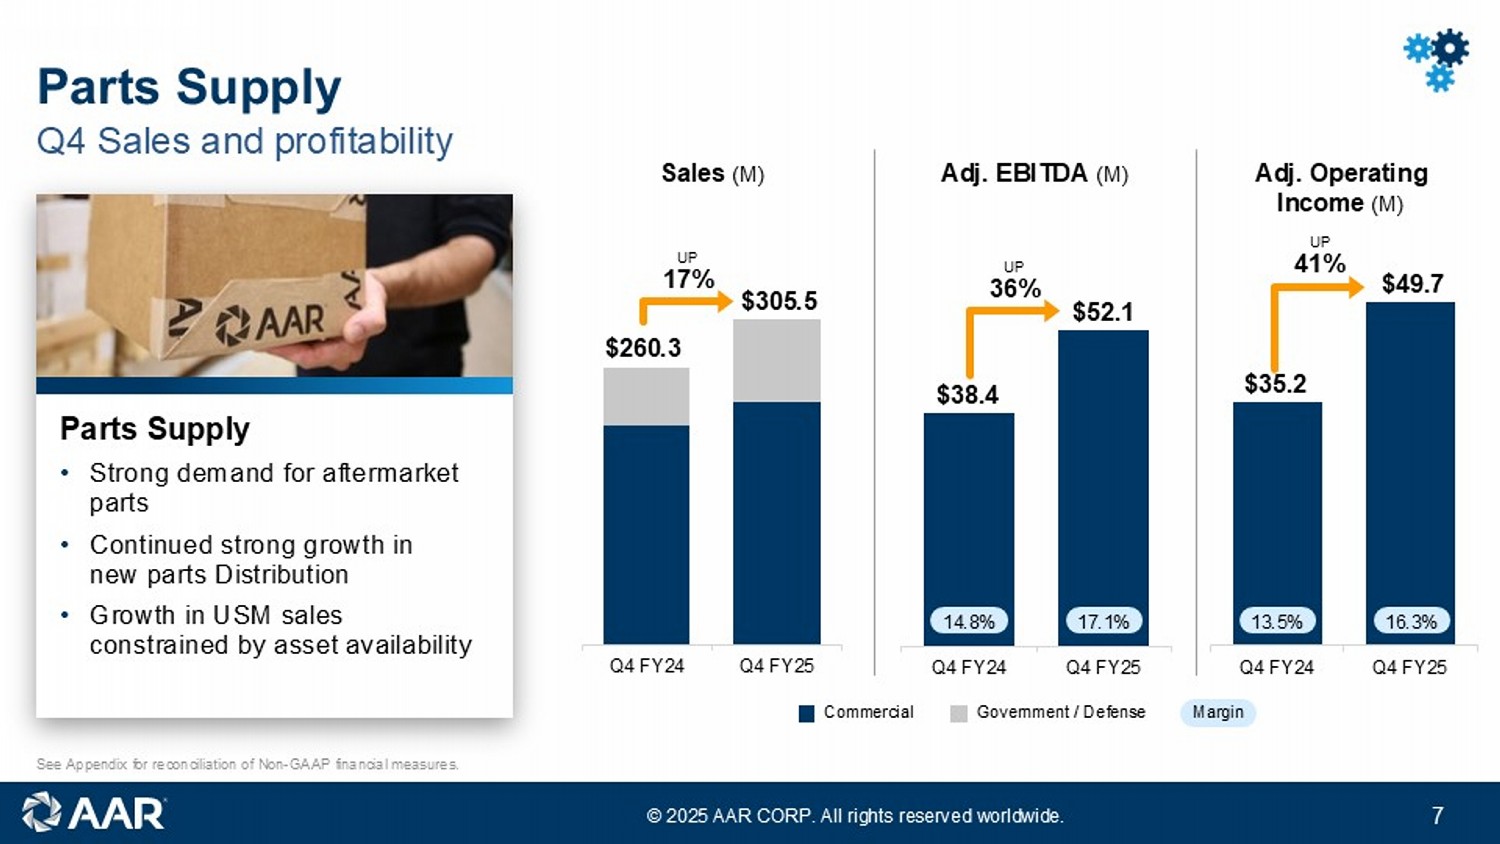
© 2025 AAR CORP. All rights reserved worldwide. 7 Q4 Sales and profitability Parts Supply See Appendix for reconciliation of Non - GAAP financial measures. Sales (M) Adj. EBITDA (M) Commercial Government / Defense Margin Q4 FY24 Q4 FY25 $38.4 $52.1 Q4 FY24 Q4 FY25 $35.2 $49.7 Q4 FY24 Q4 FY25 $260.3 $305.5 14.8% 17.1% 13.5% 16.3% Parts Supply • Strong demand for aftermarket parts • Continued strong growth in new parts Distribution • Growth in USM sales constrained by asset availability Adj. Operating Income (M) UP 17% UP 36% UP 41%
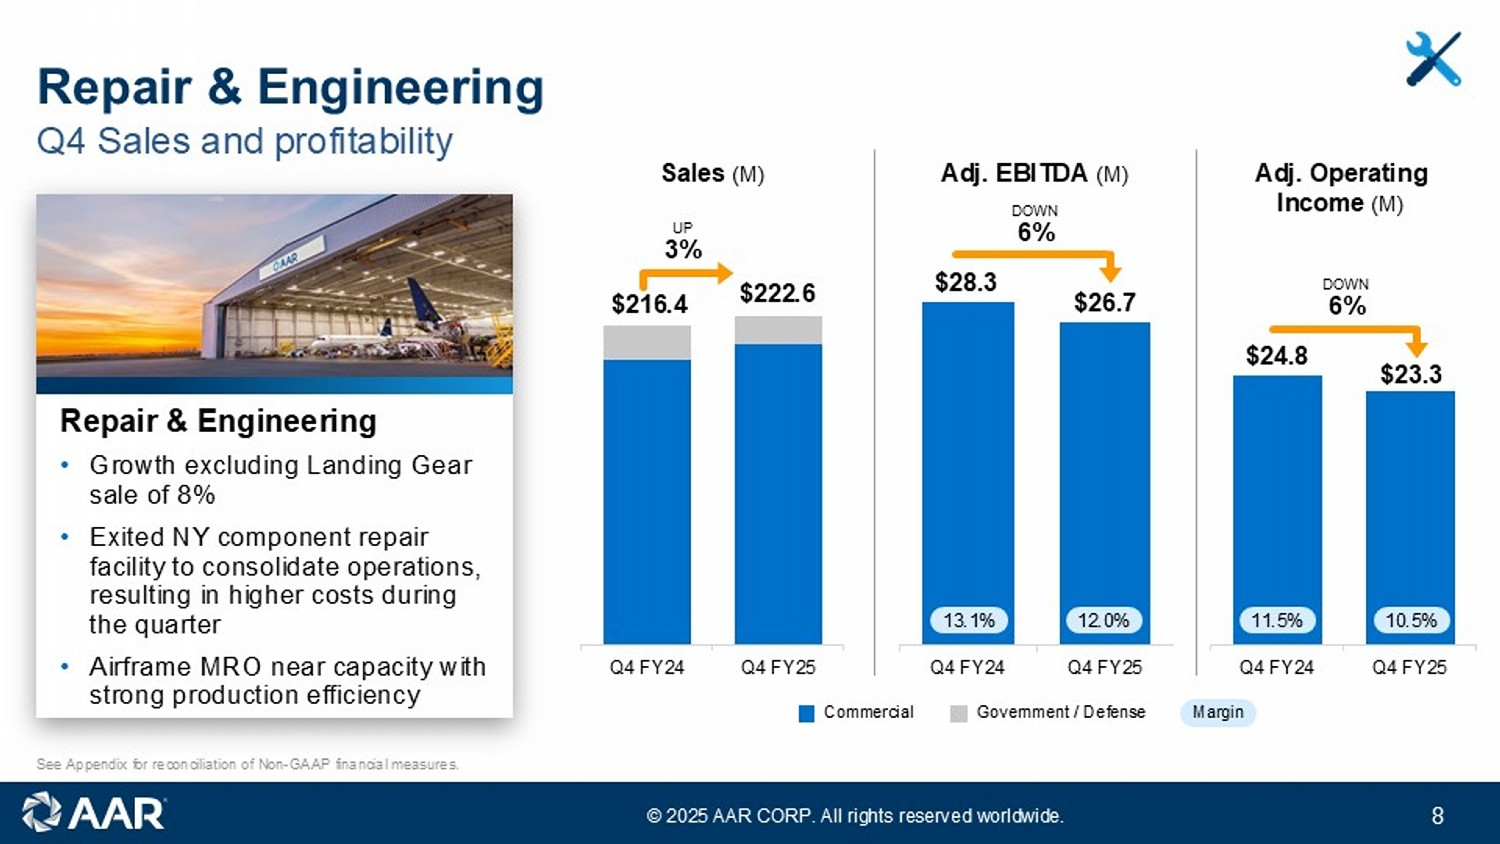
© 2025 AAR CORP. All rights reserved worldwide. 8 Q4 Sales and profitability Repair & Engineering $216.4 $222.6 Sales (M) Adj. EBITDA (M) Commercial Government / Defense Margin Q4 FY24 Q4 FY25 Q4 FY24 Q4 FY25 $28.3 $26.7 Q4 FY24 Q4 FY25 $24.8 $23.3 13.1% 12.0% 11.5% 10.5% See Appendix for reconciliation of Non - GAAP financial measures. Repair & Engineering • Growth excluding Landing Gear sale of 8% • Exited NY component repair facility to consolidate operations, resulting in higher costs during the quarter • Airframe MRO near capacity with strong production efficiency Adj. Operating Income (M) UP 3% DOWN 6% DOWN 6%
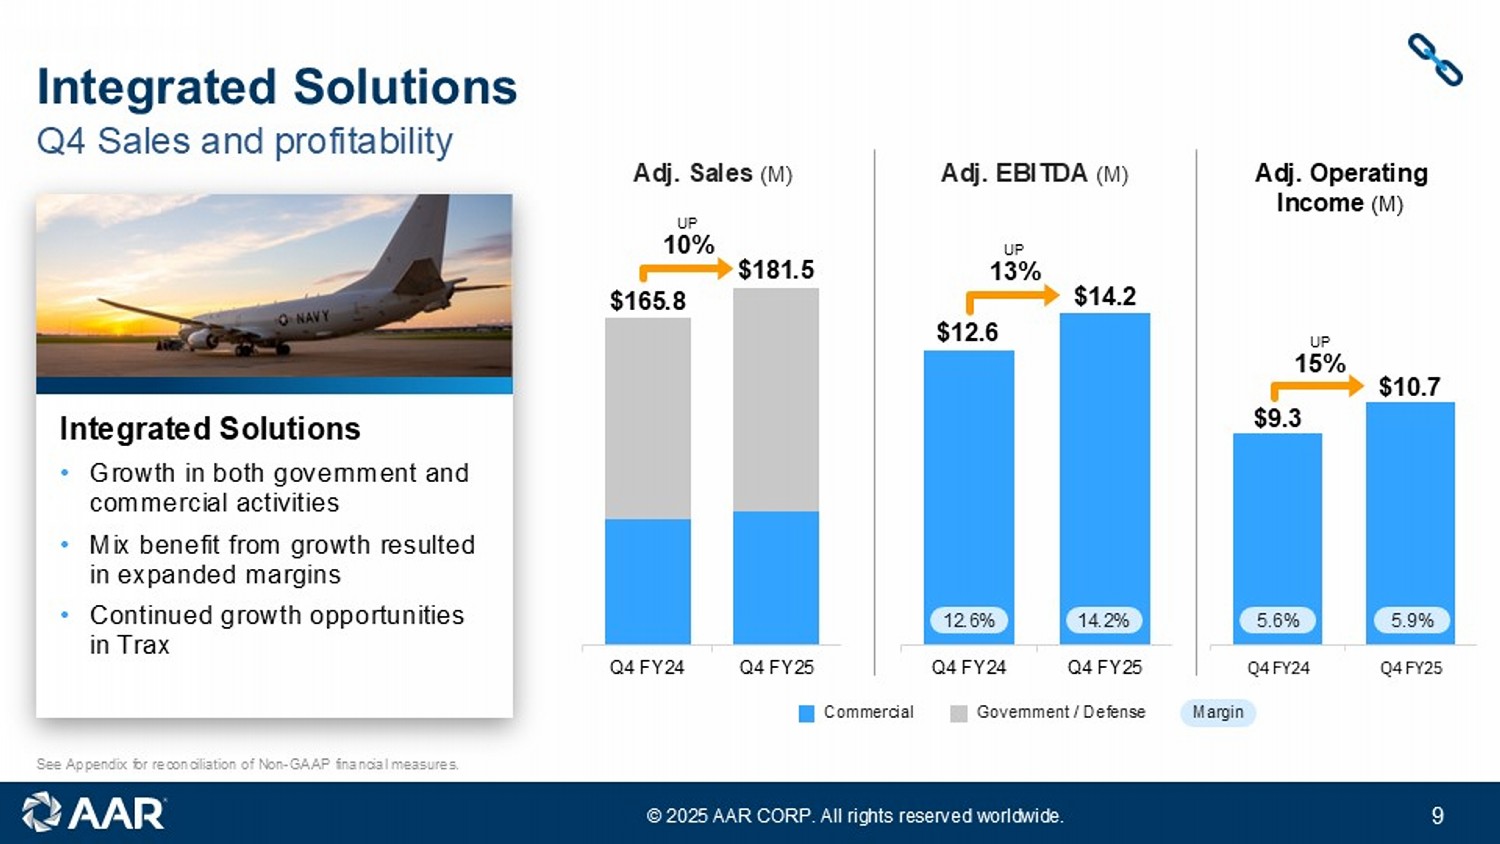
© 2025 AAR CORP. All rights reserved worldwide. 9 Adj. Sales (M) Adj. EBITDA (M) Q4 Sales and profitability Integrated Solutions See Appendix for reconciliation of Non - GAAP financial measures. Q4 FY24 Q4 FY25 $9.3 $10.7 Q4 FY24 Q4 FY25 $12.6 $14.2 Q4 FY24 Q4 FY25 $165.8 $181.5 12.6% 14.2% 5.6% 5.9% Integrated Solutions • Growth in both government and commercial activities • Mix benefit from growth resulted in expanded margins • Continued growth opportunities in Trax Commercial Government / Defense Margin Adj. Operating Income (M) UP 10% UP 13% UP 15%
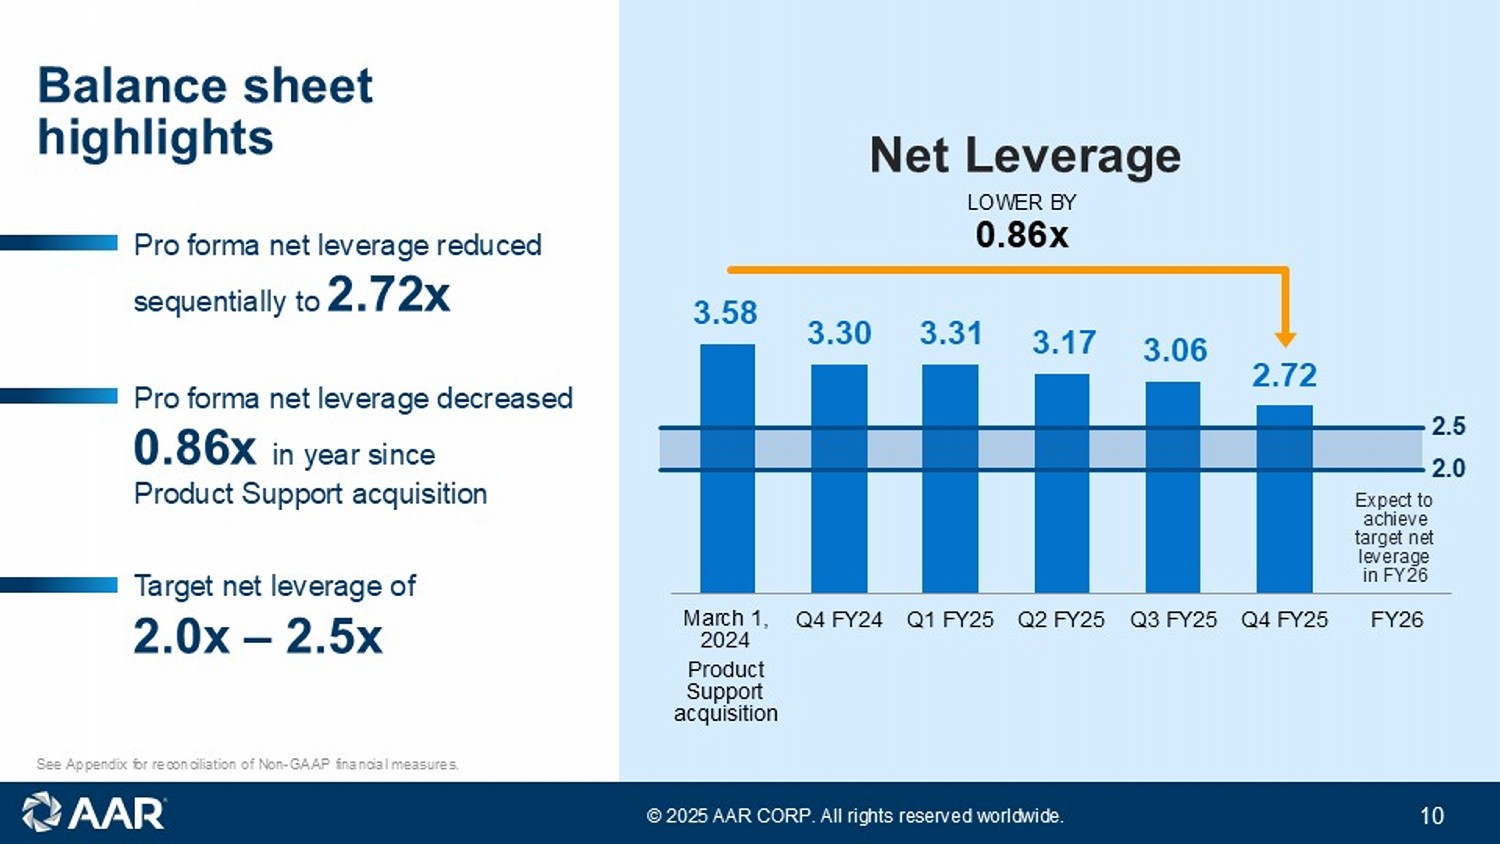
© 2025 AAR CORP. All rights reserved worldwide. 10 Balance sheet highlights See Appendix for reconciliation of Non - GAAP financial measures. Net Leverage Pro forma net leverage reduced sequentially to 2.72x Pro forma net leverage decreased 0.86x in year since Product Support acquisition Target net leverage of 2.0x – 2.5x Q4 FY24 Q1 FY25 Q2 FY25 Q3 FY25 Q4 FY25 FY26 3.17 3.31 3.30 3.58 March 1, 2024 Product Support acquisition 3.06 2.72 Expect to achieve target net leverage in FY26 2.0 2.5 LOWER BY 0.86x
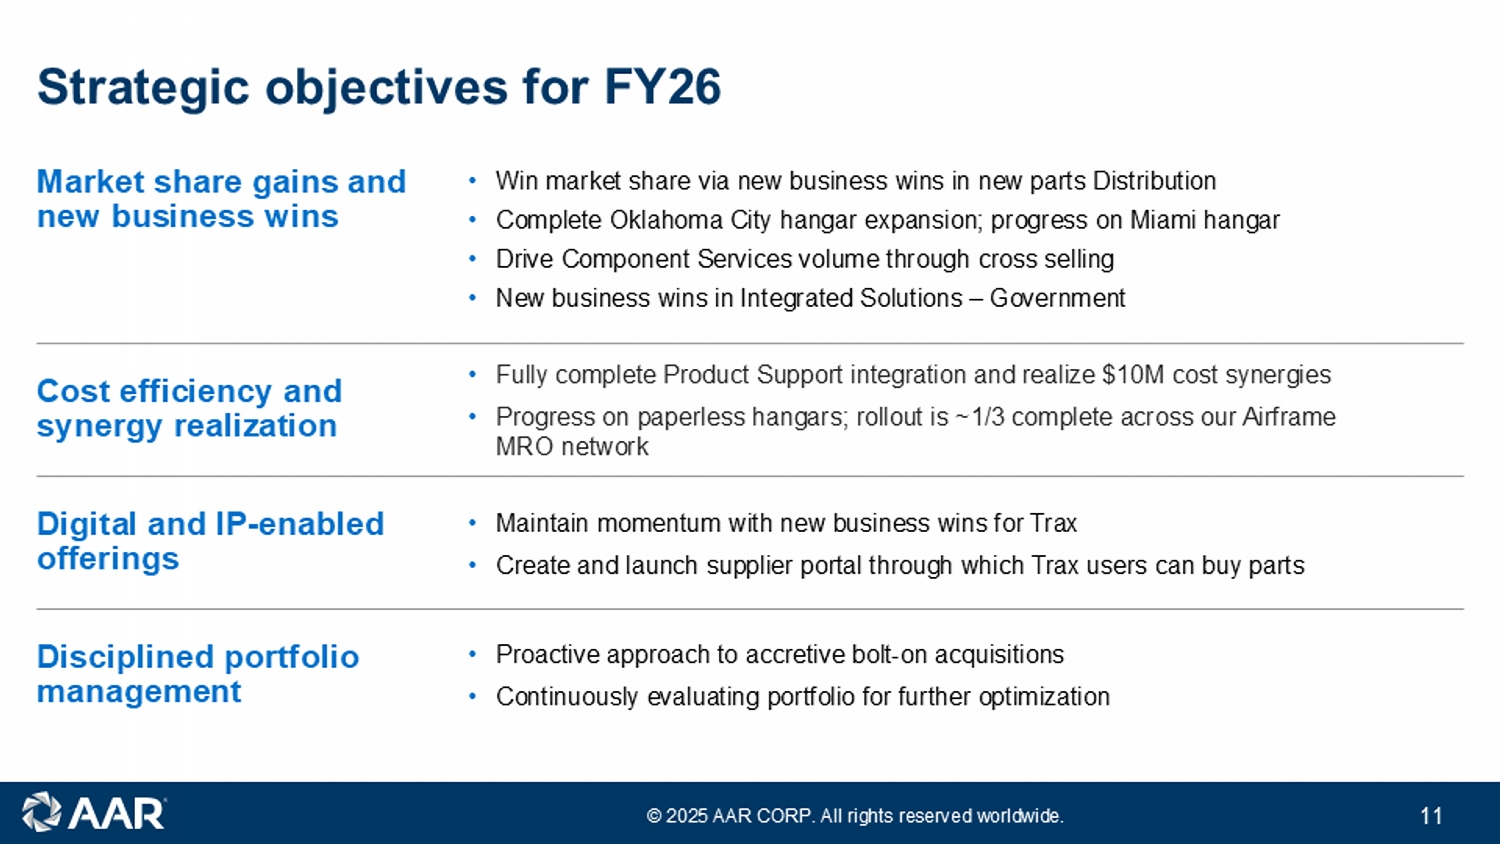
© 2025 AAR CORP. All rights reserved worldwide. 11 Strategic objectives for FY26 Market share gains and new business wins • Win market share via new business wins in new parts Distribution • Complete Oklahoma City hangar expansion; progress on Miami hangar • Drive Component Services volume through cross selling • New business wins in Integrated Solutions – Government Cost efficiency and synergy realization • Fully complete Product Support integration and realize $10M cost synergies • Progress on paperless hangars; rollout is ~1/3 complete across our Airframe MRO network Digital and IP - enabled offerings • Maintain momentum with new business wins for Trax • Create and launch supplier portal through which Trax users can buy parts Disciplined portfolio management • Proactive approach to accretive bolt - on acquisitions • Continuously evaluating portfolio for further optimization
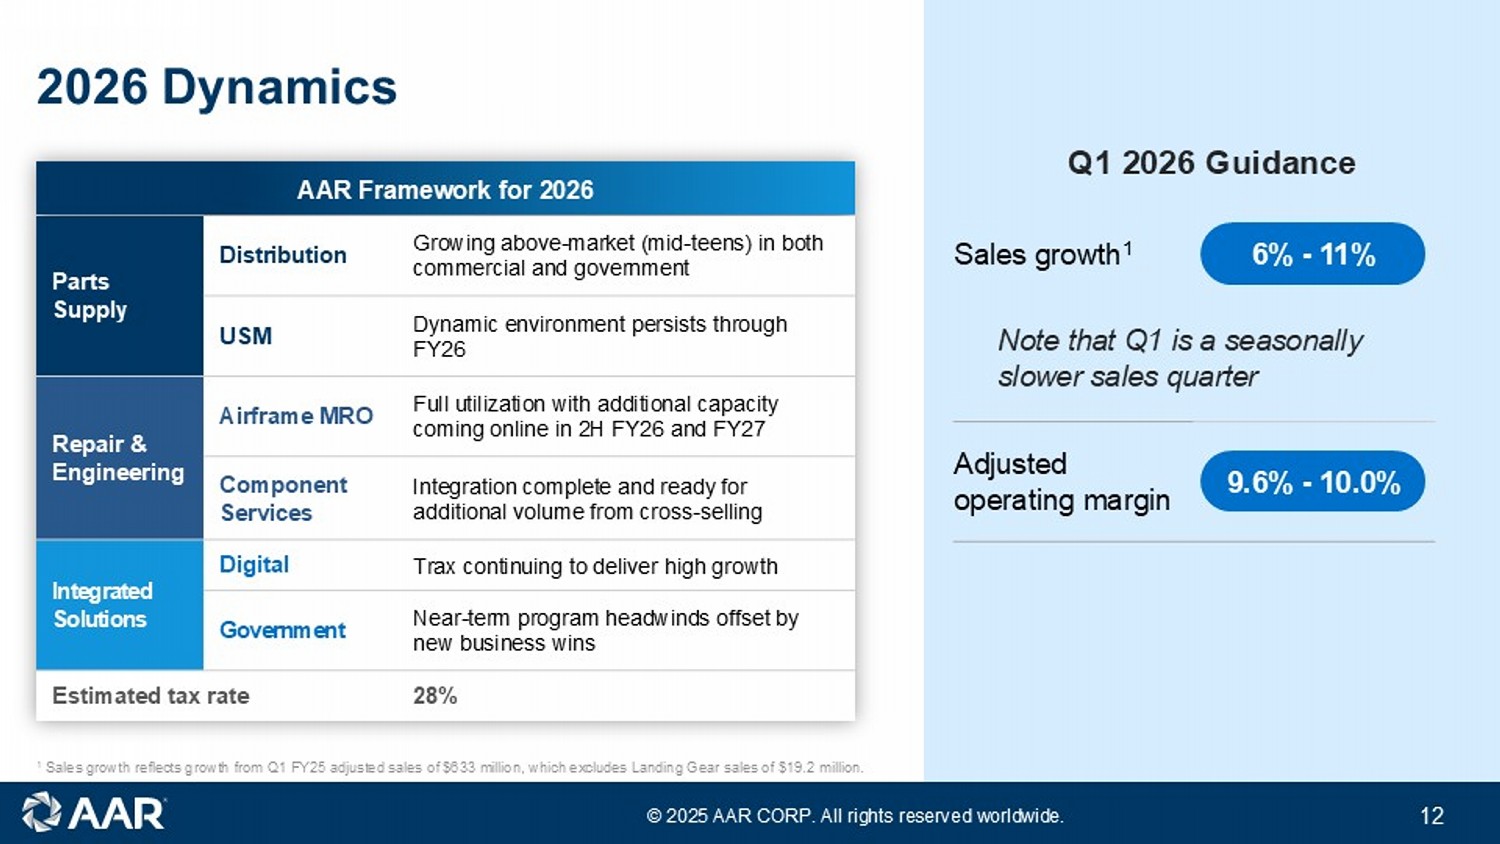
© 2025 AAR CORP. All rights reserved worldwide. 12 2026 Dynamics AAR Framework for 2026 Growing above - market (mid - teens) in both commercial and government Distribution Parts Supply Dynamic environment persists through FY26 USM Full utilization with additional capacity coming online in 2H FY26 and FY27 Airframe MRO Repair & Engineering Integration complete and ready for additional volume from cross - selling Component Services Trax continuing to deliver high growth Digital Integrated Solutions Near - term program headwinds offset by new business wins Government 28% Estimated tax rate 6% - 11% Sales growth 1 Note that Q1 is a seasonally slower sales quarter 9.6% - 10.0% Adjusted operating margin Q1 2026 Guidance 1 Sales growth reflects growth from Q1 FY25 adjusted sales of $633 million, which excludes Landing Gear sales of $19.2 million.

© 2025 AAR CORP. All rights reserved worldwide. 13 Appendix
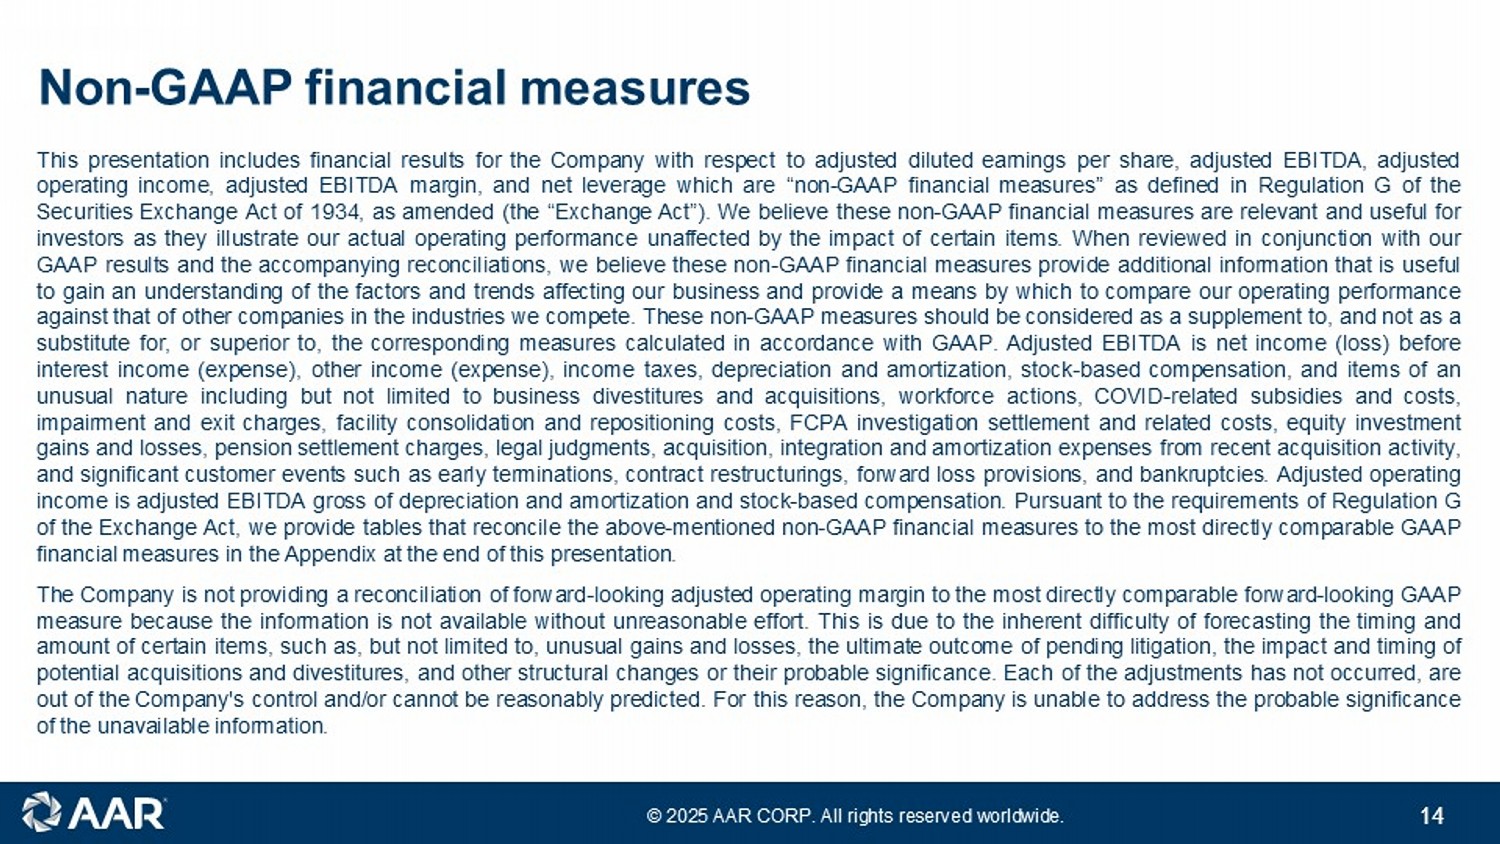
© 2025 AAR CORP. All rights reserved worldwide. 14 Non - GAAP financial measures This presentation includes financial results for the Company with respect to adjusted diluted earnings per share, adjusted EBITDA , adjusted operating income, adjusted EBITDA margin, and net leverage which are “non - GAAP financial measures” as defined in Regulation G of the Securities Exchange Act of 1934 , as amended (the “Exchange Act”) . We believe these non - GAAP financial measures are relevant and useful for investors as they illustrate our actual operating performance unaffected by the impact of certain items . When reviewed in conjunction with our GAAP results and the accompanying reconciliations, we believe these non - GAAP financial measures provide additional information that is useful to gain an understanding of the factors and trends affecting our business and provide a means by which to compare our operating performance against that of other companies in the industries we compete . These non - GAAP measures should be considered as a supplement to, and not as a substitute for, or superior to, the corresponding measures calculated in accordance with GAAP . Adjusted EBITDA is net income (loss) before interest income (expense), other income (expense), income taxes, depreciation and amortization, stock - based compensation, and items of an unusual nature including but not limited to business divestitures and acquisitions, workforce actions, COVID - related subsidies and costs, impairment and exit charges, facility consolidation and repositioning costs, FCPA investigation settlement and related costs, equity investment gains and losses, pension settlement charges, legal judgments, acquisition, integration and amortization expenses from recent acquisition activity, and significant customer events such as early terminations, contract restructurings, forward loss provisions, and bankruptcies . Adjusted operating income is adjusted EBITDA gross of depreciation and amortization and stock - based compensation . Pursuant to the requirements of Regulation G of the Exchange Act, we provide tables that reconcile the above - mentioned non - GAAP financial measures to the most directly comparable GAAP financial measures in the Appendix at the end of this presentation . The Company is not providing a reconciliation of forward - looking adjusted operating margin to the most directly comparable forward - looking GAAP measure because the information is not available without unreasonable effort . This is due to the inherent difficulty of forecasting the timing and amount of certain items, such as, but not limited to, unusual gains and losses, the ultimate outcome of pending litigation, the impact and timing of potential acquisitions and divestitures, and other structural changes or their probable significance . Each of the adjustments has not occurred, are out of the Company's control and/or cannot be reasonably predicted . For this reason, the Company is unable to address the probable significance of the unavailable information . 14
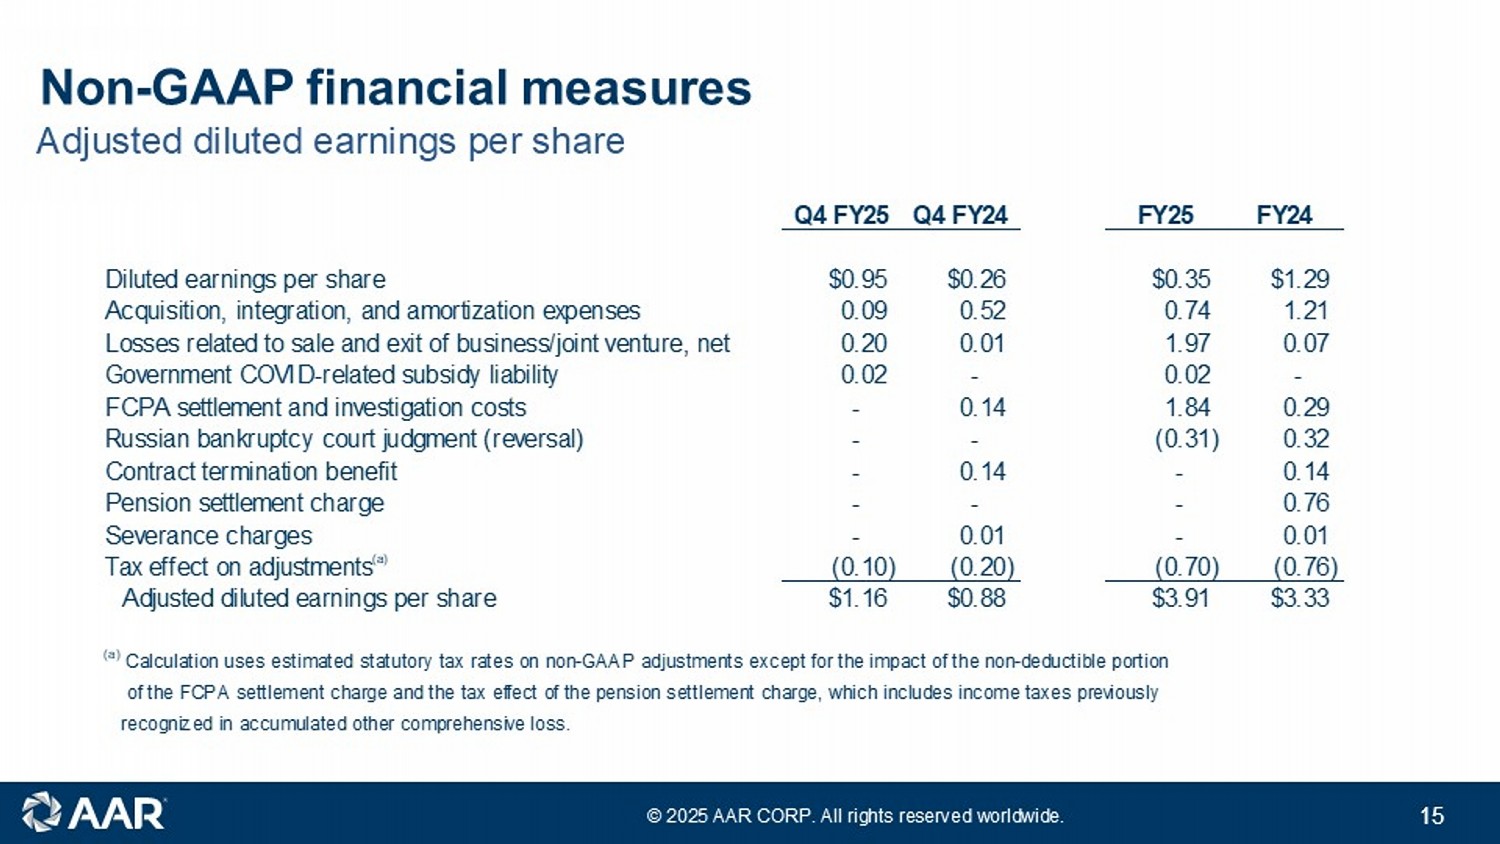
© 2025 AAR CORP. All rights reserved worldwide. 15 Adjusted diluted earnings per share Non - GAAP financial measures 15 Q4 FY25 Q4 FY24 FY25 FY24 Diluted earnings per share $0.95 $0.26 $0.35 $1.29 Acquisition, integration, and amortization expenses 0.09 0.52 0.74 1.21 Losses related to sale and exit of business/joint venture, net 0.20 0.01 1.97 0.07 Government COVID-related subsidy liability 0.02 - 0.02 - FCPA settlement and investigation costs - 0.14 1.84 0.29 Russian bankruptcy court judgment (reversal) - - (0.31) 0.32 Contract termination benefit - 0.14 - 0.14 Pension settlement charge - - - 0.76 Severance charges - 0.01 - 0.01 Tax effect on adjustments (a) (0.10) (0.20) (0.70) (0.76) Adjusted diluted earnings per share $1.16 $0.88 $3.91 $3.33 (a) Calculation uses estimated statutory tax rates on non-GAAP adjustments except for the impact of the non-deductible portion of the FCPA settlement charge and the tax effect of the pension settlement charge, which includes income taxes previously recognized in accumulated other comprehensive loss.
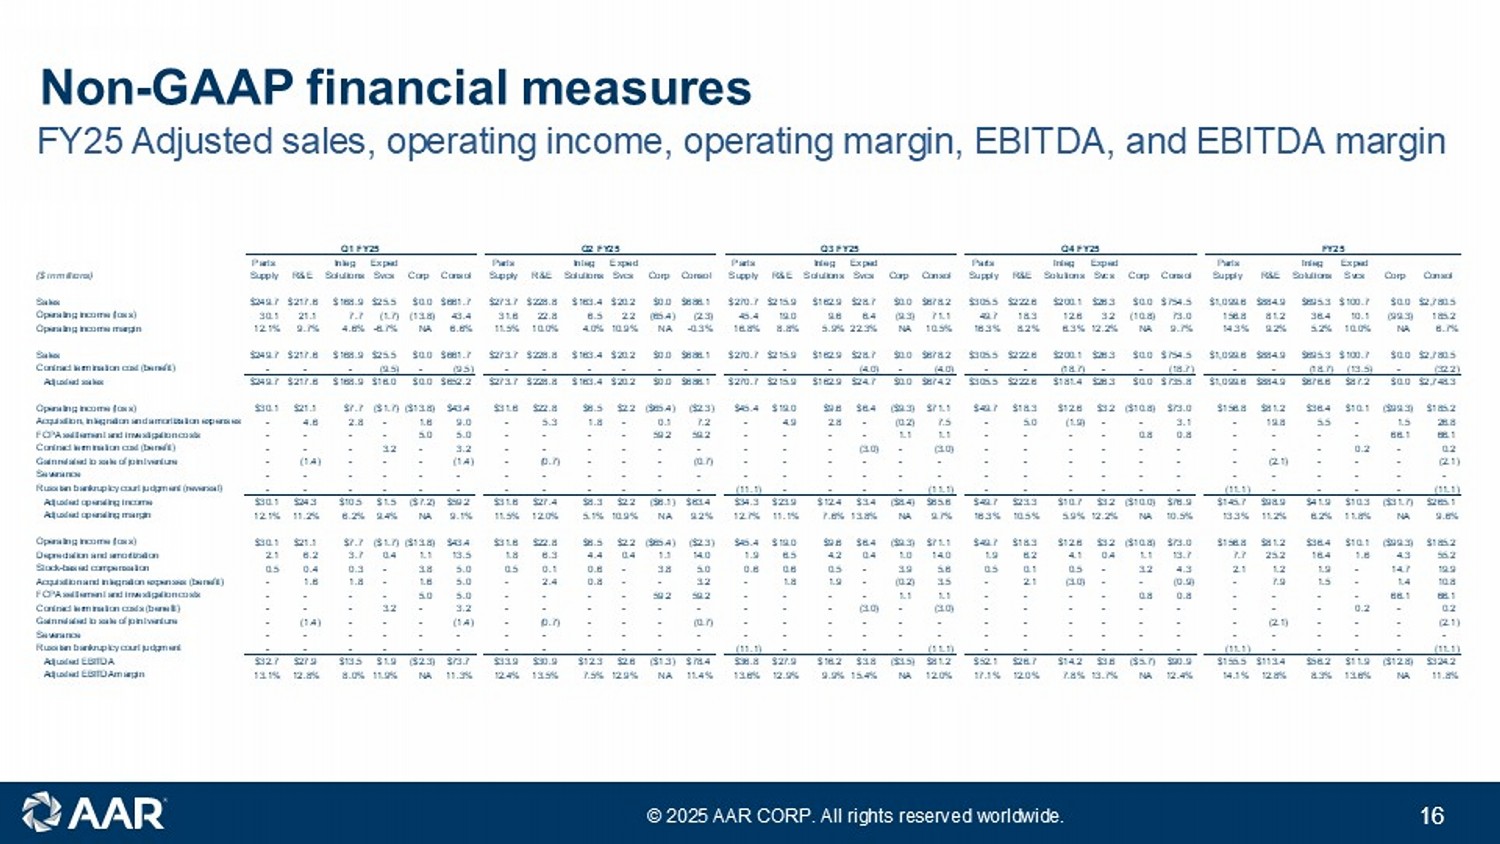
© 2025 AAR CORP. All rights reserved worldwide. 16 FY25 Adjusted sales, operating income, operating margin, EBITDA, and EBITDA margin Non - GAAP financial measures Q1 FY25 Q2 FY25 Q3 FY25 Q4 FY25 FY25 Parts Integ Exped Parts Integ Exped Parts Integ Exped Parts Integ Exped Parts Integ Exped ($ in millions) Supply R&E Solutions Svcs Corp Consol Supply R&E Solutions Svcs Corp Consol Supply R&E Solutions Svcs Corp Consol Supply R&E Solutions Svcs Corp Consol Supply R&E Solutions Svcs Corp Consol Sales $249.7 $217.6 $168.9 $25.5 $0.0 $661.7 $273.7 $228.8 $163.4 $20.2 $0.0 $686.1 $270.7 $215.9 $162.9 $28.7 $0.0 $678.2 $305.5 $222.6 $200.1 $26.3 $0.0 $754.5 $1,099.6 $884.9 $695.3 $100.7 $0.0 $2,780.5 Operating income (loss) 30.1 21.1 7.7 (1.7) (13.8) 43.4 31.6 22.8 6.5 2.2 (65.4) (2.3) 45.4 19.0 9.6 6.4 (9.3) 71.1 49.7 18.3 12.6 3.2 (10.8) 73.0 156.8 81.2 36.4 10.1 (99.3) 185.2 Operating income margin 12.1% 9.7% 4.6% -6.7% NA 6.6% 11.5% 10.0% 4.0% 10.9% NA -0.3% 16.8% 8.8% 5.9% 22.3% NA 10.5% 16.3% 8.2% 6.3% 12.2% NA 9.7% 14.3% 9.2% 5.2% 10.0% NA 6.7% Sales $249.7 $217.6 $168.9 $25.5 $0.0 $661.7 $273.7 $228.8 $163.4 $20.2 $0.0 $686.1 $270.7 $215.9 $162.9 $28.7 $0.0 $678.2 $305.5 $222.6 $200.1 $26.3 $0.0 $754.5 $1,099.6 $884.9 $695.3 $100.7 $0.0 $2,780.5 Contract termination cost (benefit) - - - (9.5) - (9.5) - - - - - - - - - (4.0) - (4.0) - - (18.7) - - (18.7) - - (18.7) (13.5) - (32.2) Adjusted sales $249.7 $217.6 $168.9 $16.0 $0.0 $652.2 $273.7 $228.8 $163.4 $20.2 $0.0 $686.1 $270.7 $215.9 $162.9 $24.7 $0.0 $674.2 $305.5 $222.6 $181.4 $26.3 $0.0 $735.8 $1,099.6 $884.9 $676.6 $87.2 $0.0 $2,748.3 Operating income (loss) $30.1 $21.1 $7.7 ($1.7) ($13.8) $43.4 $31.6 $22.8 $6.5 $2.2 ($65.4) ($2.3) $45.4 $19.0 $9.6 $6.4 ($9.3) $71.1 $49.7 $18.3 $12.6 $3.2 ($10.8) $73.0 $156.8 $81.2 $36.4 $10.1 ($99.3) $185.2 Acquisition, integration and amortization expenses - 4.6 2.8 - 1.6 9.0 - 5.3 1.8 - 0.1 7.2 - 4.9 2.8 - (0.2) 7.5 - 5.0 (1.9) - - 3.1 - 19.8 5.5 - 1.5 26.8 FCPA settlement and investigation costs - - - - 5.0 5.0 - - - - 59.2 59.2 - - - - 1.1 1.1 - - - - 0.8 0.8 - - - - 66.1 66.1 Contract termination cost (benefit) - - - 3.2 - 3.2 - - - - - - - - - (3.0) - (3.0) - - - - - - - - - 0.2 - 0.2 Gain related to sale of joint venture - (1.4) - - - (1.4) - (0.7) - - - (0.7) - - - - - - - - - - - - - (2.1) - - - (2.1) Severance - - - - - - - - - - - - - - - - - - - - - - - - - - - - - - Russian bankruptcy court judgment (reversal) - - - - - - - - - - - - (11.1) - - - - (11.1) - - - - - - (11.1) - - - - (11.1) Adjusted operating income $30.1 $24.3 $10.5 $1.5 ($7.2) $59.2 $31.6 $27.4 $8.3 $2.2 ($6.1) $63.4 $34.3 $23.9 $12.4 $3.4 ($8.4) $65.6 $49.7 $23.3 $10.7 $3.2 ($10.0) $76.9 $145.7 $98.9 $41.9 $10.3 ($31.7) $265.1 Adjusted operating margin 12.1% 11.2% 6.2% 9.4% NA 9.1% 11.5% 12.0% 5.1% 10.9% NA 9.2% 12.7% 11.1% 7.6% 13.8% NA 9.7% 16.3% 10.5% 5.9% 12.2% NA 10.5% 13.3% 11.2% 6.2% 11.8% NA 9.6% Operating income (loss) $30.1 $21.1 $7.7 ($1.7) ($13.8) $43.4 $31.6 $22.8 $6.5 $2.2 ($65.4) ($2.3) $45.4 $19.0 $9.6 $6.4 ($9.3) $71.1 $49.7 $18.3 $12.6 $3.2 ($10.8) $73.0 $156.8 $81.2 $36.4 $10.1 ($99.3) $185.2 Depreciation and amortization 2.1 6.2 3.7 0.4 1.1 13.5 1.8 6.3 4.4 0.4 1.1 14.0 1.9 6.5 4.2 0.4 1.0 14.0 1.9 6.2 4.1 0.4 1.1 13.7 7.7 25.2 16.4 1.6 4.3 55.2 Stock-based compensation 0.5 0.4 0.3 - 3.8 5.0 0.5 0.1 0.6 - 3.8 5.0 0.6 0.6 0.5 - 3.9 5.6 0.5 0.1 0.5 - 3.2 4.3 2.1 1.2 1.9 - 14.7 19.9 Acquisition and integration expenses (benefit) - 1.6 1.8 - 1.6 5.0 - 2.4 0.8 - - 3.2 - 1.8 1.9 - (0.2) 3.5 - 2.1 (3.0) - - (0.9) - 7.9 1.5 - 1.4 10.8 FCPA settlement and investigation costs - - - - 5.0 5.0 - - - - 59.2 59.2 - - - - 1.1 1.1 - - - - 0.8 0.8 - - - - 66.1 66.1 Contract termination costs (benefit) - - - 3.2 - 3.2 - - - - - - - - - (3.0) - (3.0) - - - - - - - - - 0.2 - 0.2 Gain related to sale of joint venture - (1.4) - - - (1.4) - (0.7) - - - (0.7) - - - - - - - - - - - - - (2.1) - - - (2.1) Severance - - - - - - - - - - - - - - - - - - - - - - - - - - - - - - Russian bankruptcy court judgment - - - - - - - - - - - - (11.1) - - - - (11.1) - - - - - - (11.1) - - - - (11.1) Adjusted EBITDA $32.7 $27.9 $13.5 $1.9 ($2.3) $73.7 $33.9 $30.9 $12.3 $2.6 ($1.3) $78.4 $36.8 $27.9 $16.2 $3.8 ($3.5) $81.2 $52.1 $26.7 $14.2 $3.6 ($5.7) $90.9 $155.5 $113.4 $56.2 $11.9 ($12.8) $324.2 Adjusted EBITDA margin 13.1% 12.8% 8.0% 11.9% NA 11.3% 12.4% 13.5% 7.5% 12.9% NA 11.4% 13.6% 12.9% 9.9% 15.4% NA 12.0% 17.1% 12.0% 7.8% 13.7% NA 12.4% 14.1% 12.8% 8.3% 13.6% NA 11.8% 16
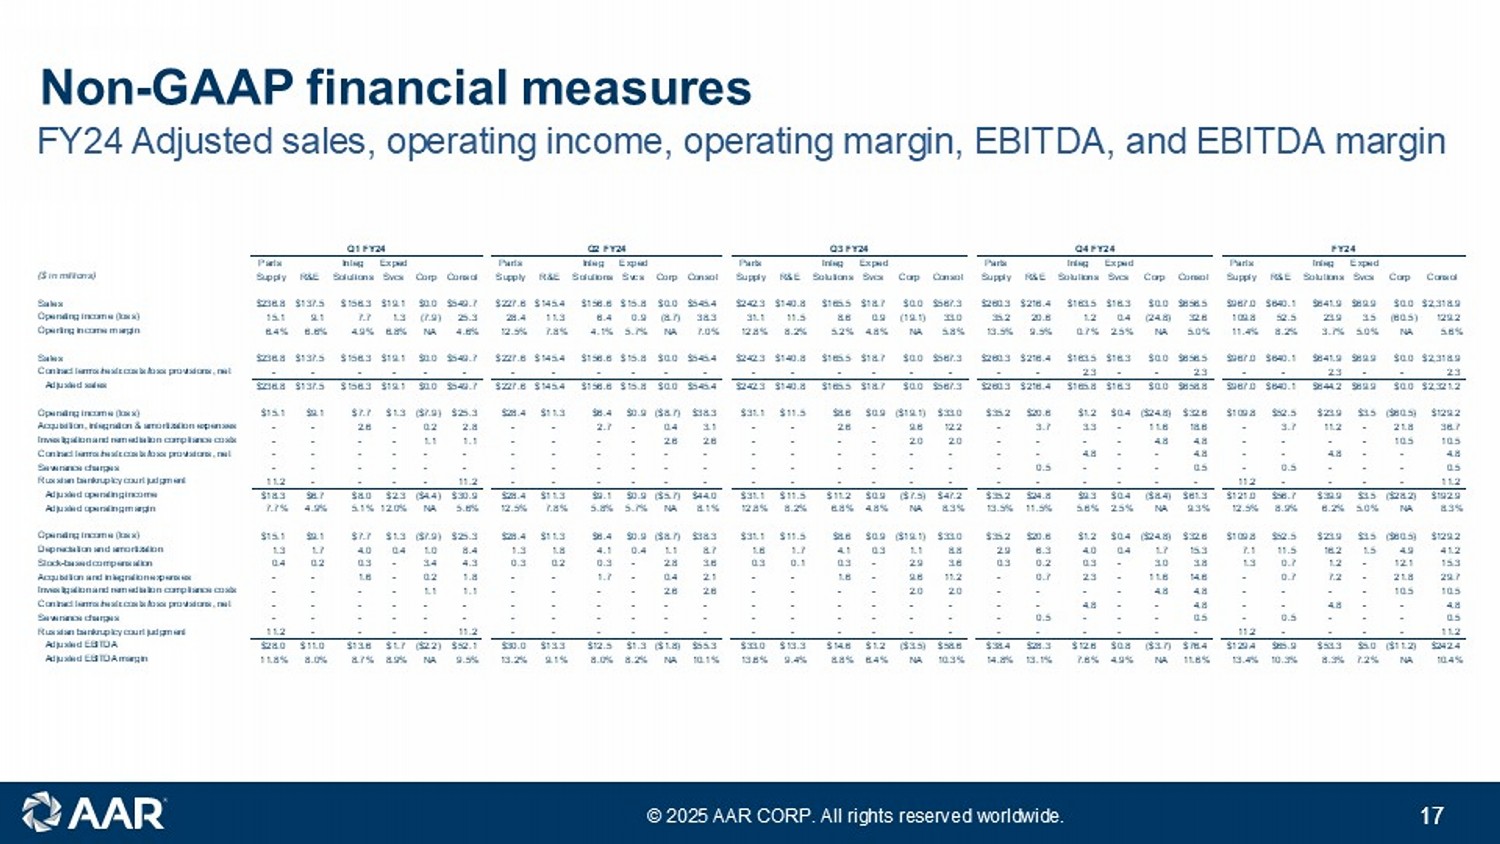
© 2025 AAR CORP. All rights reserved worldwide. 17 FY24 Adjusted sales, operating income, operating margin, EBITDA, and EBITDA margin Non - GAAP financial measures Q1 FY24 Q2 FY24 Q3 FY24 Q4 FY24 FY24 Parts Integ Exped Parts Integ Exped Parts Integ Exped Parts Integ Exped Parts Integ Exped ($ in millions) Supply R&E Solutions Svcs Corp Consol Supply R&E Solutions Svcs Corp Consol Supply R&E Solutions Svcs Corp Consol Supply R&E Solutions Svcs Corp Consol Supply R&E Solutions Svcs Corp Consol Sales $236.8 $137.5 $156.3 $19.1 $0.0 $549.7 $227.6 $145.4 $156.6 $15.8 $0.0 $545.4 $242.3 $140.8 $165.5 $18.7 $0.0 $567.3 $260.3 $216.4 $163.5 $16.3 $0.0 $656.5 $967.0 $640.1 $641.9 $69.9 $0.0 $2,318.9 Operating income (loss) 15.1 9.1 7.7 1.3 (7.9) 25.3 28.4 11.3 6.4 0.9 (8.7) 38.3 31.1 11.5 8.6 0.9 (19.1) 33.0 35.2 20.6 1.2 0.4 (24.8) 32.6 109.8 52.5 23.9 3.5 (60.5) 129.2 Operting income margin 6.4% 6.6% 4.9% 6.8% NA 4.6% 12.5% 7.8% 4.1% 5.7% NA 7.0% 12.8% 8.2% 5.2% 4.8% NA 5.8% 13.5% 9.5% 0.7% 2.5% NA 5.0% 11.4% 8.2% 3.7% 5.0% NA 5.6% Sales $236.8 $137.5 $156.3 $19.1 $0.0 $549.7 $227.6 $145.4 $156.6 $15.8 $0.0 $545.4 $242.3 $140.8 $165.5 $18.7 $0.0 $567.3 $260.3 $216.4 $163.5 $16.3 $0.0 $656.5 $967.0 $640.1 $641.9 $69.9 $0.0 $2,318.9 Contract terms/restr.costs/loss provisions, net - - - - - - - - - - - - - - - - - - - - 2.3 - - 2.3 - - 2.3 - - 2.3 Adjusted sales $236.8 $137.5 $156.3 $19.1 $0.0 $549.7 $227.6 $145.4 $156.6 $15.8 $0.0 $545.4 $242.3 $140.8 $165.5 $18.7 $0.0 $567.3 $260.3 $216.4 $165.8 $16.3 $0.0 $658.8 $967.0 $640.1 $644.2 $69.9 $0.0 $2,321.2 Operating income (loss) $15.1 $9.1 $7.7 $1.3 ($7.9) $25.3 $28.4 $11.3 $6.4 $0.9 ($8.7) $38.3 $31.1 $11.5 $8.6 $0.9 ($19.1) $33.0 $35.2 $20.6 $1.2 $0.4 ($24.8) $32.6 $109.8 $52.5 $23.9 $3.5 ($60.5) $129.2 Acquisition, integration & amortization expenses - - 2.6 - 0.2 2.8 - - 2.7 - 0.4 3.1 - - 2.6 - 9.6 12.2 - 3.7 3.3 - 11.6 18.6 - 3.7 11.2 - 21.8 36.7 Investigation and remediation compliance costs - - - - 1.1 1.1 - - - - 2.6 2.6 - - - - 2.0 2.0 - - - - 4.8 4.8 - - - - 10.5 10.5 Contract terms/restr.costs/loss provisions, net - - - - - - - - - - - - - - - - - - - - 4.8 - - 4.8 - - 4.8 - - 4.8 Severance charges - - - - - - - - - - - - - - - - - - - 0.5 - - - 0.5 - 0.5 - - - 0.5 Russian bankruptcy court judgment 11.2 - - - - 11.2 - - - - - - - - - - - - - - - - - - 11.2 - - - - 11.2 Adjusted operating income $18.3 $6.7 $8.0 $2.3 ($4.4) $30.9 $28.4 $11.3 $9.1 $0.9 ($5.7) $44.0 $31.1 $11.5 $11.2 $0.9 ($7.5) $47.2 $35.2 $24.8 $9.3 $0.4 ($8.4) $61.3 $121.0 $56.7 $39.9 $3.5 ($28.2) $192.9 Adjusted operating margin 7.7% 4.9% 5.1% 12.0% NA 5.6% 12.5% 7.8% 5.8% 5.7% NA 8.1% 12.8% 8.2% 6.8% 4.8% NA 8.3% 13.5% 11.5% 5.6% 2.5% NA 9.3% 12.5% 8.9% 6.2% 5.0% NA 8.3% Operating income (loss) $15.1 $9.1 $7.7 $1.3 ($7.9) $25.3 $28.4 $11.3 $6.4 $0.9 ($8.7) $38.3 $31.1 $11.5 $8.6 $0.9 ($19.1) $33.0 $35.2 $20.6 $1.2 $0.4 ($24.8) $32.6 $109.8 $52.5 $23.9 $3.5 ($60.5) $129.2 Depreciation and amortization 1.3 1.7 4.0 0.4 1.0 8.4 1.3 1.8 4.1 0.4 1.1 8.7 1.6 1.7 4.1 0.3 1.1 8.8 2.9 6.3 4.0 0.4 1.7 15.3 7.1 11.5 16.2 1.5 4.9 41.2 Stock-based compensation 0.4 0.2 0.3 - 3.4 4.3 0.3 0.2 0.3 - 2.8 3.6 0.3 0.1 0.3 - 2.9 3.6 0.3 0.2 0.3 - 3.0 3.8 1.3 0.7 1.2 - 12.1 15.3 Acquisition and integration expenses - - 1.6 - 0.2 1.8 - - 1.7 - 0.4 2.1 - - 1.6 - 9.6 11.2 - 0.7 2.3 - 11.6 14.6 - 0.7 7.2 - 21.8 29.7 Investigation and remediation compliance costs - - - - 1.1 1.1 - - - - 2.6 2.6 - - - - 2.0 2.0 - - - - 4.8 4.8 - - - - 10.5 10.5 Contract terms/restr.costs/loss provisions, net - - - - - - - - - - - - - - - - - - - - 4.8 - - 4.8 - - 4.8 - - 4.8 Severance charges - - - - - - - - - - - - - - - - - - - 0.5 - - - 0.5 - 0.5 - - - 0.5 Russian bankruptcy court judgment 11.2 - - - - 11.2 - - - - - - - - - - - - - - - - - - 11.2 - - - - 11.2 Adjusted EBITDA $28.0 $11.0 $13.6 $1.7 ($2.2) $52.1 $30.0 $13.3 $12.5 $1.3 ($1.8) $55.3 $33.0 $13.3 $14.6 $1.2 ($3.5) $58.6 $38.4 $28.3 $12.6 $0.8 ($3.7) $76.4 $129.4 $65.9 $53.3 $5.0 ($11.2) $242.4 Adjusted EBITDA margin 11.8% 8.0% 8.7% 8.9% NA 9.5% 13.2% 9.1% 8.0% 8.2% NA 10.1% 13.6% 9.4% 8.8% 6.4% NA 10.3% 14.8% 13.1% 7.6% 4.9% NA 11.6% 13.4% 10.3% 8.3% 7.2% NA 10.4% 17
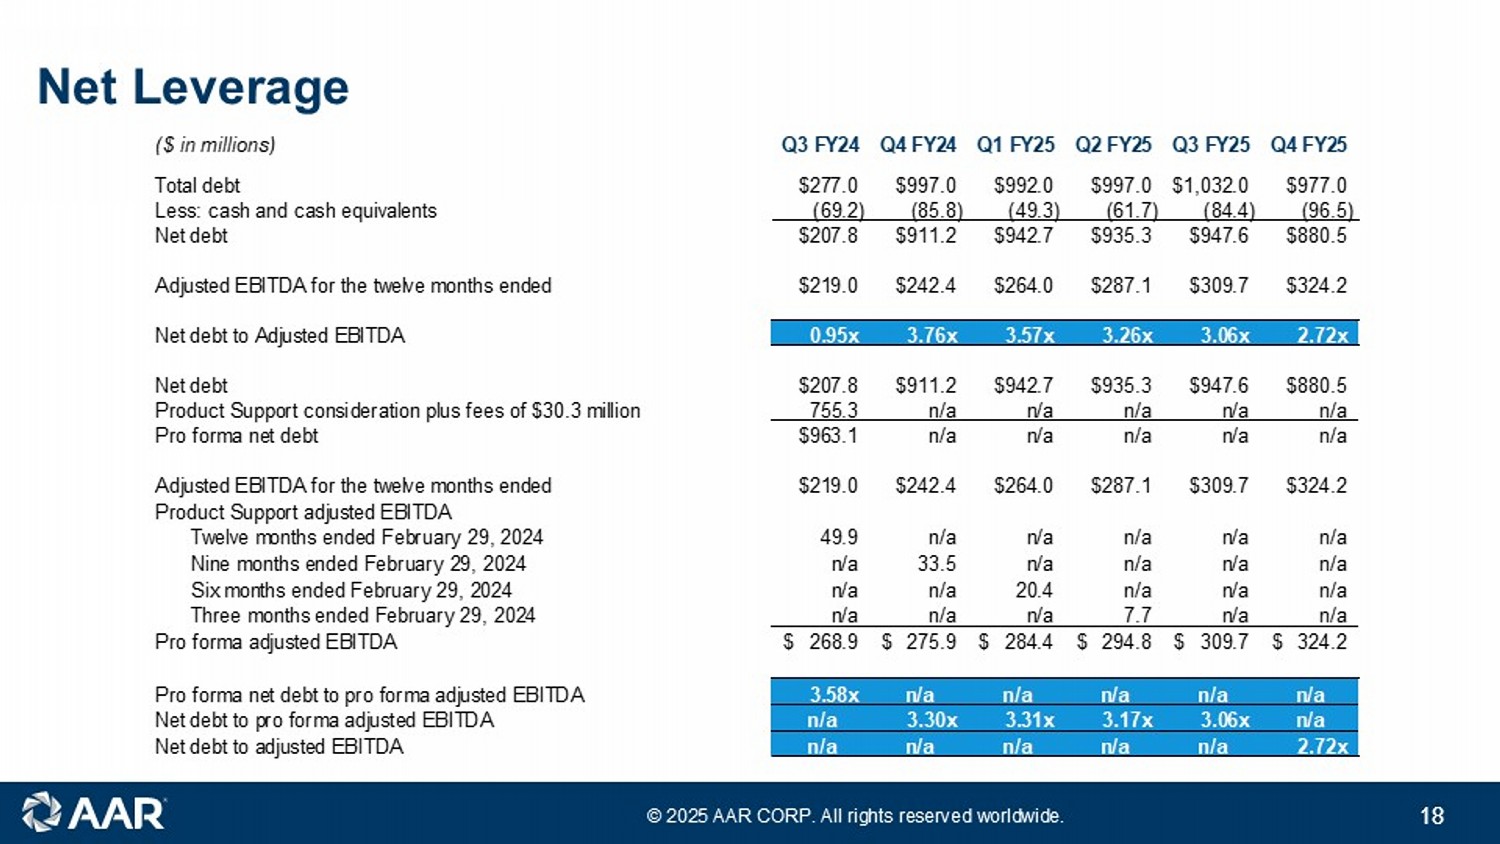
© 2025 AAR CORP. All rights reserved worldwide. 18 Net Leverage 18 ($ in millions) Q3 FY24 Q4 FY24 Q1 FY25 Q2 FY25 Q3 FY25 Q4 FY25 Total debt $277.0 $997.0 $992.0 $997.0 $1,032.0 $977.0 Less: cash and cash equivalents (69.2) (85.8) (49.3) (61.7) (84.4) (96.5) Net debt $207.8 $911.2 $942.7 $935.3 $947.6 $880.5 Adjusted EBITDA for the twelve months ended $219.0 $242.4 $264.0 $287.1 $309.7 $324.2 Net debt to Adjusted EBITDA 0.95x 3.76x 3.57x 3.26x 3.06x 2.72x Net debt $207.8 $911.2 $942.7 $935.3 $947.6 $880.5 Product Support consideration plus fees of $30.3 million 755.3 n/a n/a n/a n/a n/a Pro forma net debt $963.1 n/a n/a n/a n/a n/a Adjusted EBITDA for the twelve months ended $219.0 $242.4 $264.0 $287.1 $309.7 $324.2 Product Support adjusted EBITDA Twelve months ended February 29, 2024 49.9 n/a n/a n/a n/a n/a Nine months ended February 29, 2024 n/a 33.5 n/a n/a n/a n/a Six months ended February 29, 2024 n/a n/a 20.4 n/a n/a n/a Three months ended February 29, 2024 n/a n/a n/a 7.7 n/a n/a Pro forma adjusted EBITDA 268.9$ 275.9$ 284.4$ 294.8$ 309.7$ 324.2$ Pro forma net debt to pro forma adjusted EBITDA 3.58x n/a n/a n/a n/a n/a Net debt to pro forma adjusted EBITDA n/a 3.30x 3.31x 3.17x 3.06x n/a Net debt to adjusted EBITDA n/a n/a n/a n/a n/a 2.72x